Introduction
Microsoft Power BI combines data preparation, semantic modeling, interactive dashboards, enterprise distribution, and close Microsoft integration in one business intelligence platform.
Its strongest value appears when you want to replace scattered spreadsheets and departmental reports with reusable semantic models, governed metrics, and dashboards shared through Microsoft 365 or Microsoft Fabric. The tradeoff is complexity, because production use requires attention to DAX, data modeling, security, refresh architecture, licensing, and capacity.
This Power BI review examines data connectors, Power Query, semantic models, dashboards, Copilot, collaboration, performance, pricing, integrations, and alternatives.
How We Evaluated Power BI
The assessment follows the full BI lifecycle, from connecting and preparing data to modeling, reporting, sharing, governance, and scale. It draws on current Microsoft documentation and pricing, implementation requirements, and recurring themes in verified user feedback. Scores reflect practical product fit rather than a laboratory benchmark.
Quick Assessment
Power BI Review Summary
Power BI remains one of the strongest overall BI choices for organizations that already use Excel, Teams, Azure, Microsoft 365, Dynamics 365, or Microsoft Fabric. It provides an unusually broad path from individual analysis in Power BI Desktop to governed enterprise reporting.
The platform is less straightforward when you need polished visual exploration without modeling work, simple licensing for a large viewer population, or a native desktop authoring experience on macOS. Copilot is also not included simply because you buy a Pro or Premium Per User license.
Power BI at a Glance
| Category | Power BI Assessment |
| Best For | Microsoft-centered organizations and teams building governed self-service BI |
| Overall Score | 9.1/10 |
| Ease of Use | 8.0/10 |
| Data Connectivity | 9.3/10 |
| Modeling and Analytics | 9.4/10 |
| Visualization | 8.8/10 |
| Governance | 9.1/10 |
| Starting Price | Free Desktop application; Power BI Pro from $14 per user/month, paid yearly |
| Main Strength | Strong modeling, Microsoft integration, and scalable distribution options |
| Main Limitation | Advanced use requires DAX, data modeling, governance, and licensing expertise |
Recommendation: Power BI is easy to recommend when your data team wants a mature semantic modeling layer and your business users already work in Microsoft tools. Smaller teams can start inexpensively, while larger organizations can move toward Fabric capacity, deployment pipelines, row-level security, and centrally managed semantic models.
Platform Overview
What Is Microsoft Power BI?
Microsoft Power BI is a business intelligence and data visualization platform for connecting data, transforming it, creating semantic models, building interactive reports, and distributing insights.
Power BI Desktop is the free Windows application used for Power Query, modeling, DAX, and report creation. The Power BI service adds cloud workspaces, sharing, apps, refresh management, governance, and collaboration. Power BI also extends into mobile analytics, paginated reporting, embedded analytics, APIs, Report Server, and Microsoft Fabric.
Where Power BI Fits in Your Data Stack
Power BI usually sits between prepared business data and decision-makers. Source data may come from Excel, SaaS tools, databases, warehouses, lakehouses, or Fabric. Power Query prepares it, semantic models define relationships and measures, and reports turn those definitions into interactive analysis.
Who Should Use Power BI?
- Microsoft-focused businesses: Connect analytics with Excel, Teams, Azure, Dynamics, and Fabric.
- Analysts and finance teams: Build governed models, measures, and recurring reports.
- Operations leaders: Monitor performance across systems, teams, and locations.
- Enterprises: Apply security, deployment, lineage, and capacity controls.
Who May Prefer Another BI Platform?
Consider another platform when you need Mac-first desktop authoring, highly flexible visual exploration without extensive modeling, simpler external-viewer licensing, or only a few basic SaaS dashboards.
Key Features
Data, Modeling, Dashboards, and AI
Power BI’s advantage is how its features connect. You can move from raw data to a reusable model, create reports, distribute them through apps or workspaces, and govern access without changing platforms.
Data Connectors and Power Query
Power BI supports files, databases, cloud warehouses, SaaS applications, Microsoft services, OData, web sources, ODBC, and JSON. Common connectors include Excel, SQL Server, Salesforce, Snowflake, Google BigQuery, Oracle, SharePoint, and Dataverse.
Power Query records repeatable transformation steps for cleaning, merging, appending, pivoting, and standardizing data. Complex enterprise pipelines may still belong in a warehouse or dedicated integration platform.
Semantic Models and DAX
Semantic models define relationships, hierarchies, measures, security roles, and reusable business logic. DAX supports advanced calculations such as time intelligence and cohort analysis, but it has a meaningful learning curve.
Import, DirectQuery, Direct Lake, and Composite Models
Import mode usually delivers the fastest interaction. DirectQuery leaves data in the source, Direct Lake works with Fabric data in OneLake, and composite models combine approaches. Choosing the wrong mode can create avoidable refresh or performance problems.
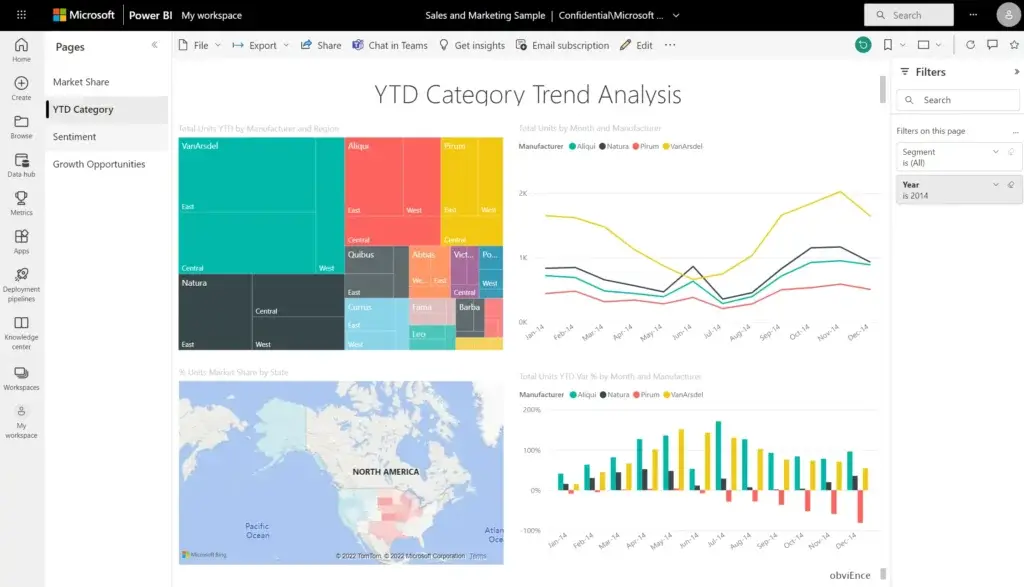
Interactive Reports and Visualization
You can build charts, matrices, maps, KPI cards, drill-through pages, bookmarks, tooltips, decomposition trees, and custom visuals. Cross-filtering makes reports useful for exploration, although Tableau may feel more fluid for visualization-led analysis.
Copilot and AI-Assisted Analytics
Copilot can help create report pages, summarize findings, and answer questions about supported semantic models. Model quality is critical, and Pro or Premium Per User alone is not sufficient. Supported paid Fabric or Power BI Premium capacity is required.
Sharing, Governance, and Deployment
The service provides workspaces, apps, subscriptions, Teams and SharePoint embedding, Excel connectivity, row-level and object-level security, sensitivity labels, lineage, audit data, and tenant controls. Deployment pipelines help move content through development, test, and production.
Power BI Feature Overview
| Feature Area | What Power BI Provides | Best For |
| Data Preparation | Power Query transformations and refresh workflows | Cleaning and combining data |
| Semantic Modeling | Relationships, measures, DAX, and security | Governed business metrics |
| Visualization | Interactive reports, drill-through, maps, and custom visuals | Operational and executive analysis |
| AI | Copilot, summaries, and natural-language assistance | Accelerating supported analytics |
| Collaboration | Workspaces, apps, Teams, SharePoint, Excel, and subscriptions | Distributing insights |
| Governance | RLS, OLS, labels, lineage, audit data, and pipelines | Enterprise BI management |
Pros and Cons
Benefits and Limitations
Positive
✅ Excellent Microsoft integration
✅ Advanced semantic modeling
✅ Strong value for creators
✅ Mature governance controls
Negative
❌ Advanced DAX learning curve
❌ Licensing can become complex
❌ Desktop authoring favors Windows
❌ Copilot needs paid capacity
✅ Power BI Pros
- Power Query, DAX, and semantic models provide substantial analytical depth.
- Power BI Desktop lets analysts start without a software fee.
- Microsoft 365, Azure, Dynamics 365, and Fabric integration is excellent.
- Reusable models help standardize KPIs across multiple reports.
- Governance features support large and regulated organizations.
❌ Power BI Cons
- Advanced DAX and model design take time to learn.
- Viewer licensing becomes harder to plan at scale.
- Power BI Desktop is a Windows-first application.
- DirectQuery performance depends on the source system.
- Copilot requires supported paid capacity.
Power BI works best as a managed analytics platform. Without standards, its flexibility can lead to duplicated models, inconsistent metrics, and crowded workspaces.
Getting Started
Setup, Dashboard Building, and Support
The easiest starting point is Power BI Desktop. You can connect an Excel file or cloud source, transform the data, create relationships and measures, then build a report before deciding how to distribute it.
Account Setup and Initial Configuration
Desktop can be installed from Microsoft and requires Windows, while the Power BI service works in supported browsers on Windows and macOS. Organizational use also requires licenses, workspaces, permissions, and clear ownership.
Building a Dashboard in Power BI
Begin with a business question rather than a chart list. A SaaS executive dashboard, for example, may need recurring revenue, churn, acquisition cost, pipeline coverage, and regional performance.
- Connect and clean the required business tables.
- Create a star schema and reusable DAX measures.
- Build an overview page with KPIs, trends, and variances.
- Add drill-through pages for important segments.
- Apply security and validate results with stakeholders.
- Publish, configure refresh, and distribute through an app.
The chart-building stage is usually faster than cleaning data, validating measures, and deciding which questions the report must answer.
Ease of Use by Role
Business users can learn filtering and report navigation quickly. Creators need more time because Power BI combines visualization with data preparation and modeling. BI developers must also understand performance, security, deployment, and lifecycle management.
Customer Support and Learning Resources
Microsoft provides extensive documentation, learning paths, certification, community forums, samples, and monthly updates. Larger deployments may still benefit from an experienced architect or partner for governance, capacity, security, and model standards.
Performance and Scalability
Models, Refresh, and Optimization
Power BI can support small spreadsheet dashboards and large enterprise analytics estates. Performance depends on storage mode, source systems, model design, DAX, visual count, gateway sizing, network latency, and capacity.
Import, DirectQuery, and Direct Lake Performance
Import mode generally provides the fastest interaction. DirectQuery supports fresher data but every visual depends on the source and network. Composite models and aggregations can import summary data while retaining detailed DirectQuery access. Direct Lake offers another option for Fabric data in OneLake.
Refresh Limits and Capacity Planning
Power BI Pro supports up to eight scheduled refreshes per day. PPU and Premium or Fabric capacity support up to 48. Imported models on shared capacity have a two-hour refresh timeout, while Premium environments provide five hours.
Incremental refresh, efficient Power Query steps, reliable gateways, and source optimization are essential. More capacity can relieve pressure, but it will not correct a poor model.
Practical Performance Checklist
- Use a star schema and remove unused columns.
- Limit unnecessary visuals and high-cardinality fields.
- Test DAX and report pages with performance tools.
- Optimize DirectQuery sources and gateway infrastructure.
- Monitor refreshes and Fabric capacity utilization.
Real-World Power BI Use Cases
Where the Platform Delivers Value
Executive and Financial Reporting
Power BI can combine revenue, margin, cash flow, budget variance, headcount, and operational KPIs. Finance teams can retain Excel for flexible analysis while using governed Power BI measures as the shared source of truth.
Sales and Marketing Analytics
Combine CRM, advertising, website, product, and finance data to analyze pipeline, win rate, acquisition cost, attribution, and revenue. See this guide to CRM sales forecasting.
Manufacturing and Operations
Track output, downtime, quality, inventory, suppliers, and delivery across ERP, MES, spreadsheets, and databases. These manufacturing KPIs offer useful dashboard examples.
IT Service and Support Analytics
Measure SLA performance, resolution time, backlog, change success, and recurring problems. Use this ITSM metrics and KPIs guide to plan the model.
What Users Say About Power BI
Reviewers commonly praise interactive dashboards, broad connectivity, Microsoft integration, and multi-source reporting. Recurring concerns include DAX, performance with poorly modeled data, setup complexity, and enterprise licensing.
Pricing and Licensing
How Much Does Power BI Cost?
Power BI pricing starts simply and becomes more complex as your audience expands. The key distinction is between free authoring, per-user licenses, and organizational capacity.
Power BI Pricing Plans
| Plan | Current Price Reference | Best For |
| Power BI Desktop | Free | Individual authoring and local analysis |
| Fabric Free | Free | Personal use and qualifying capacity-hosted content |
| Power BI Pro | $14 per user/month, paid yearly | Publishing and collaboration in shared capacity |
| Power BI Premium Per User | $24 per user/month, paid yearly | Premium features for a contained user group |
| Microsoft Fabric Capacity | Capacity and region dependent | Large-scale distribution and Fabric workloads |
| Power BI Embedded | Capacity and usage dependent | Customer-facing application analytics |
These are public US list references and may vary by country, tax, currency, contract, or enterprise agreement. Verify live pricing before purchasing.
Free and Pro Options
Power BI Desktop is a strong free starting point, but secure cloud sharing requires the service and appropriate licensing. At the public annual price, 10 Pro users cost about $140 per month before tax. In shared capacity, recipients generally need Pro or PPU.
Premium Per User
PPU includes Pro and adds many Premium features. Ten PPU users cost about $240 per month before tax, but all users accessing PPU content generally need PPU. It does not provide organizational Fabric capacity.
Microsoft Fabric Capacity
Fabric capacity provides shared compute for Power BI and other Fabric workloads. It can support broader consumption, advanced workloads, and Copilot eligibility, but cost depends on capacity, concurrency, refresh demand, model size, and other workloads.
Hidden Costs and Overall Value
Total cost may include a warehouse or lakehouse, gateways, implementation, training, governance, custom visuals, and model maintenance. Power BI offers excellent value for analysts and smaller Microsoft-centered teams, while enterprise buyers should model architecture and distribution costs rather than rely on a seat price alone.
Integrations
Microsoft Ecosystem and Data Connections
Microsoft 365 and Business Applications
Power BI integrates closely with Excel, Teams, SharePoint, Azure, Dynamics 365, and Microsoft Fabric. You can analyze governed models in Excel, place reports in collaboration tools, and keep identity and administration inside the Microsoft ecosystem.
Databases, Warehouses, and SaaS Tools
Connectors cover SQL databases, Oracle, Snowflake, Google BigQuery, Salesforce, SAP sources, OData, and many other systems. Confirm whether each source supports Import, DirectQuery, query folding, incremental refresh, single sign-on, and gateway-free access.
Power Automate, Power Apps, APIs, and Embedded Analytics
Power Automate can trigger workflows from reports, Power Apps can place operational forms beside analytics, and APIs, XMLA endpoints, and embedded options support technical administration and customer-facing use cases.
On-Premises Data Gateway
The gateway connects supported private-network sources with Microsoft cloud services. It supports refresh and DirectQuery, but becomes production infrastructure that needs updates, redundancy, monitoring, and appropriate sizing.
Comparison
Power BI Alternatives
The right Power BI alternative depends on whether you prioritize visual exploration, associative discovery, warehouse governance, or simplicity.
Power BI Alternatives Compared
| Platform | Main Strength | Best Fit |
| Power BI | Microsoft integration and semantic modeling | Microsoft-centered BI |
| Tableau | Flexible visual exploration | Visualization-led analysts |
| Qlik Cloud Analytics | Associative analytics | Complex data discovery |
| Looker | Governed cloud semantics | Warehouse-centric data teams |
| Zoho Analytics | Accessible business reporting | Small and mid-sized businesses |
Power BI vs Tableau
Tableau is stronger when visual exploration is the leading priority. Power BI is usually better for Microsoft integration, DAX modeling, Excel compatibility, and lower-cost entry.
Power BI vs Qlik Cloud Analytics
Qlik Cloud Analytics emphasizes associative analysis and governed discovery. Power BI is easier to position in Microsoft-centered organizations, while Qlik suits teams that value its independent data and analytics platform.
Power BI vs Looker
Looker suits cloud-native data teams that want business definitions close to the warehouse. Power BI provides a more accessible path for Excel-oriented analysts and broader self-service reporting.
Power BI vs Zoho Analytics
Zoho Analytics offers simpler cloud reporting and lower administration for smaller businesses. Power BI provides deeper modeling, governance, and Microsoft integration.
Final Thoughts
Is Power BI Worth It?
Power BI is worth considering when you already rely on Microsoft products and need more than basic dashboarding. Power Query, DAX, semantic models, interactive reports, Microsoft 365 distribution, Fabric integration, and governance create a strong path from self-service reporting to enterprise BI.
The platform delivers the most value when you standardize metrics, models, workspaces, security, and deployment. It is not effortless, because DAX, storage modes, refresh architecture, licensing, and capacity planning require expertise.
Choose Power BI for scalable Microsoft-centered analytics. Consider Tableau for visual exploration, Looker for warehouse-led governance, Qlik for associative discovery, or Zoho Analytics for simpler departmental reporting.
Frequently Asked Questions
Have More Questions?
What is Power BI?
Power BI is Microsoft’s platform for connecting data, building semantic models, creating interactive reports, and sharing analytics through the cloud, Microsoft 365, and Fabric.
Is Power BI free?
Power BI Desktop is free on Windows. Secure cloud sharing generally requires Pro, Premium Per User, or qualifying Fabric or Power BI Premium capacity.
How much does Power BI cost?
Current US pricing lists Pro at $14 per user/month and Premium Per User at $24, paid yearly. Capacity and embedded pricing vary by usage.
Is Power BI easy to learn?
Basic reports are approachable. Advanced modeling, DAX, DirectQuery, security, performance, and governance require more training.
Does Power BI work on Mac?
The service works in supported macOS browsers, but Power BI Desktop requires Windows for full authoring.
What is the difference between Power BI Desktop and Power BI Service?
Desktop handles preparation, modeling, DAX, and report creation. The service handles publishing, sharing, refresh, apps, and governance.
Does Power BI include AI and Copilot?
Copilot requires supported paid Fabric or Power BI Premium capacity and administrator enablement. Pro or PPU alone is insufficient.
Can Power BI handle large datasets?
Yes. Import, DirectQuery, Direct Lake, incremental refresh, and Fabric capacity support large workloads, but performance depends on architecture.
What are the best Power BI alternatives?
Top alternatives include Tableau for visualization, Qlik for associative analysis, Looker for governed cloud analytics, and Zoho Analytics for simpler reporting.
Is Power BI worth it?
Power BI is worth it for strong modeling, Microsoft integration, and scalable BI. It is less suitable for Mac-first authoring or minimal administration.