
Introduction
The best business intelligence software no longer stops at dashboards. Leading BI platforms now combine governed semantic models, natural-language analysis, automated insights, data applications, embedded analytics, and AI agents that can help users move from a question to an action.
That shift makes product selection more difficult. A visually impressive dashboard tool may be a poor fit if your real problem is inconsistent metrics. A powerful AI assistant may produce unreliable answers when your data model lacks governance. A low per-user price can also become expensive once you add capacity, warehouse compute, implementation, training, and viewer access.
This guide ranks the eight best BI tools for 2026 using practical criteria: analytical depth, usability, visualization, AI capabilities, data architecture, governance, scalability, and total value. Microsoft Power BI ranks first overall, while Tableau, Qlik Cloud Analytics, Sigma, ThoughtSpot, Looker, Domo, and Databox lead in more specialized use cases.
Best Business Intelligence Software at a Glance
The ranking below reflects overall product strength, not a claim that one platform is best for every company. Your ideal choice depends on your data stack, user skills, governance requirements, reporting style, and budget.
| Rank | BI Software | Best For | Editorial Score | Public Starting Price |
| 1 | Microsoft Power BI | Best overall and Microsoft ecosystems | 9.2/10 | Free Desktop; Pro from $14/user/month |
| 2 | Tableau | Visual exploration and data storytelling | 9.0/10 | Viewer from $15/user/month |
| 3 | Qlik Cloud Analytics | Associative data discovery | 8.9/10 | Starter from $300/month for 10 users |
| 4 | Sigma | Spreadsheet-style warehouse analytics | 8.8/10 | Custom quote |
| 5 | ThoughtSpot | Conversational and agentic analytics | 8.7/10 | Essentials from $25/user/month |
| 6 | Google Cloud Looker | Governed semantic modeling and embedding | 8.6/10 | Custom quote |
| 7 | Domo | All-in-one operational BI | 8.5/10 | Custom quote |
| 8 | Databox | Fast KPI dashboards and self-service reporting | 8.4/10 | Free; Analyst from $64/month |
Pricing references use publicly listed entry points where available and may vary by region, contract, capacity, add-ons, and usage. Verify current pricing with each vendor before purchasing.
How We Ranked the Best BI Tools
We weighted the criteria that most strongly affect long-term BI success. Analytics and modeling received 20%, usability 15%, visualization 15%, AI and conversational analytics 15%, data connectivity and architecture 15%, governance and security 10%, and overall value 10%.
Scores reflect current product capabilities, official documentation, public pricing, implementation requirements, and practical fit across common business use cases. They are editorial assessments, not controlled performance benchmarks. A lower-ranked platform can still be the better choice when its architecture aligns more closely with your organization.
Top 8 BI Analytics Software for 2026
Microsoft Power BI
Overview:
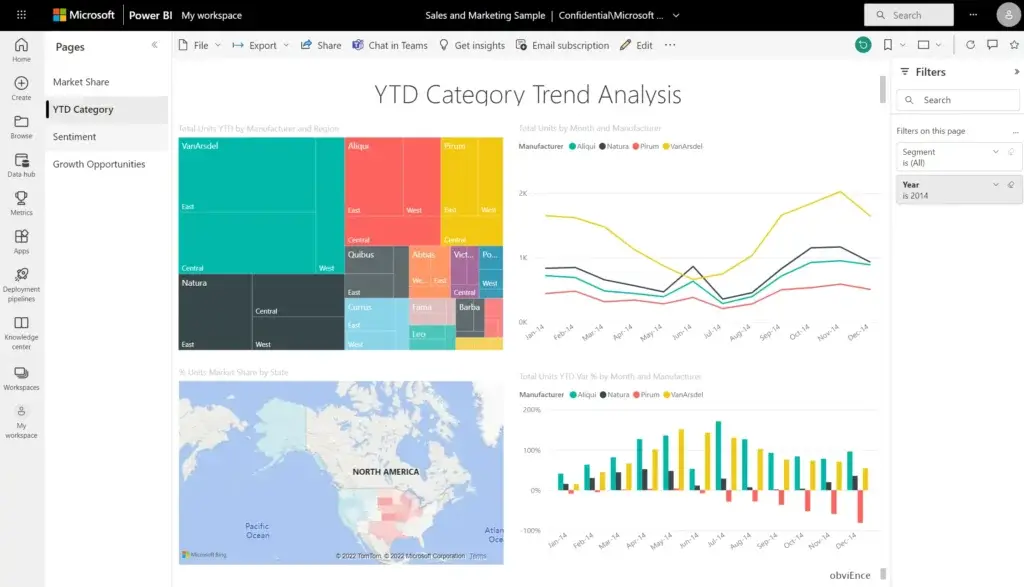
Microsoft Power BI earns the top position because it offers the strongest overall balance of modeling depth, usability, ecosystem integration, governance, scalability, and entry-level value. You can begin with the free Windows desktop application, build reports with Power Query and DAX, then distribute governed analytics through the Power BI service and Microsoft Fabric.
Top Features:
- Power Query for repeatable data preparation
- DAX measures and reusable semantic models
- Copilot for report creation, summaries, and model assistance
- Deep integration with Excel, Teams, Azure, and Fabric
- Import, DirectQuery, Direct Lake, and embedded analytics
Why It Ranks Here:
Power BI is not the simplest BI product once your deployment grows, but it covers more of the analytics lifecycle than most alternatives. Recent Copilot and Fabric improvements strengthen report authoring, natural-language analysis, semantic model documentation, and organization-wide analytics. The key limitation is licensing and capacity complexity, especially when Copilot, large audiences, or demanding workloads are involved.
Best Use Case:
Power BI is best for Microsoft-centered organizations, finance teams, analysts, and enterprises that want a governed path from desktop analysis to large-scale BI. Read our full Power BI review for a deeper analysis of features, pricing, limitations, and alternatives.
Pros and Cons:
Positives
✅ Excellent Microsoft integration
✅ Advanced data modeling
✅ Strong value for creators
✅ Mature governance controls
Negatives
❌ DAX takes time to master
❌ Licensing can become complex
❌ Desktop authoring favors Windows
❌ Copilot needs eligible capacity
Tableau

Overview:
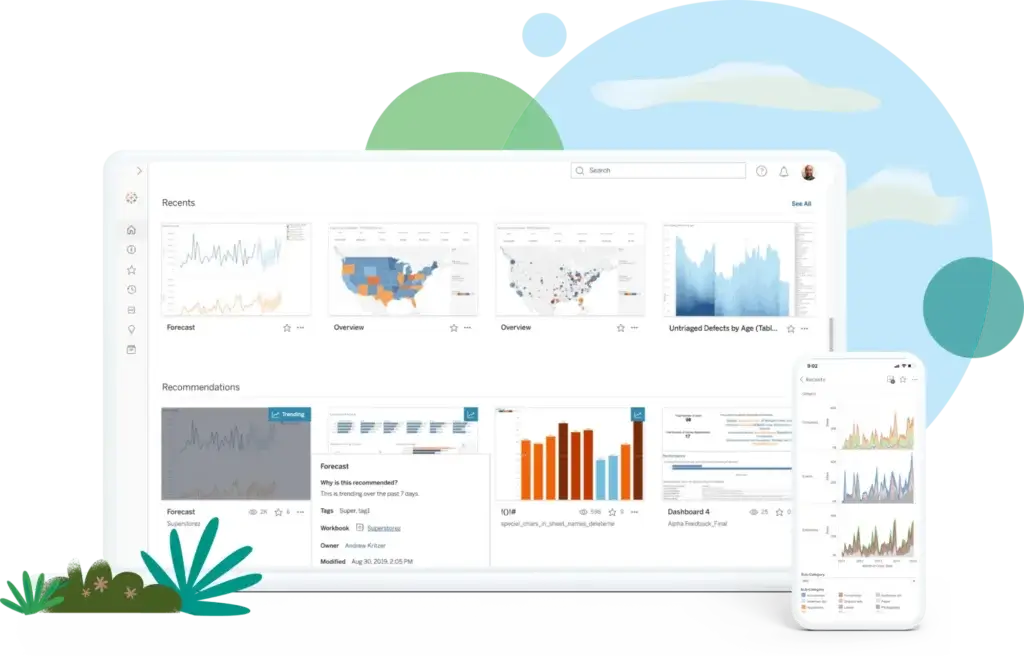
Tableau remains the strongest choice when visual analysis and data storytelling matter more than low-cost licensing. Its drag-and-drop authoring environment gives analysts considerable freedom to explore data, test hypotheses, and design interactive dashboards without forcing every question into a fixed reporting template.
Top Features:
- Flexible drag-and-drop visual analytics
- Tableau Pulse for personalized metric insights
- Tableau Agent for AI-assisted analysis and authoring
- Tableau Next for API-first, agentic analytics
- Cloud, Server, embedded, and public deployment options
Why It Ranks Here:
Tableau has expanded beyond classic visualization through Pulse, Tableau Agent, and Tableau Next. These products bring conversational analysis, proactive metric summaries, trusted semantics, and deeper Salesforce integration into the platform. It ranks below Power BI because pricing is higher for many teams and enterprise governance can require more administration, but its visual exploration experience remains difficult to match.
Best Use Case:
Tableau is best for analyst-led organizations, executive reporting, data journalism, and teams that need polished, highly interactive visual analysis. Read our full Tableau review for a deeper analysis of features, pricing, limitations, and alternatives.
Pros and Cons:
Positives
✅ Best-in-class visual exploration
✅ Strong dashboard flexibility
✅ Large community and ecosystem
✅ Growing AI analytics layer
Negatives
❌ Higher creator pricing
❌ Governance needs planning
❌ Complex workbooks can slow down
❌ Advanced AI may need higher tiers
Qlik Cloud Analytics
Overview:
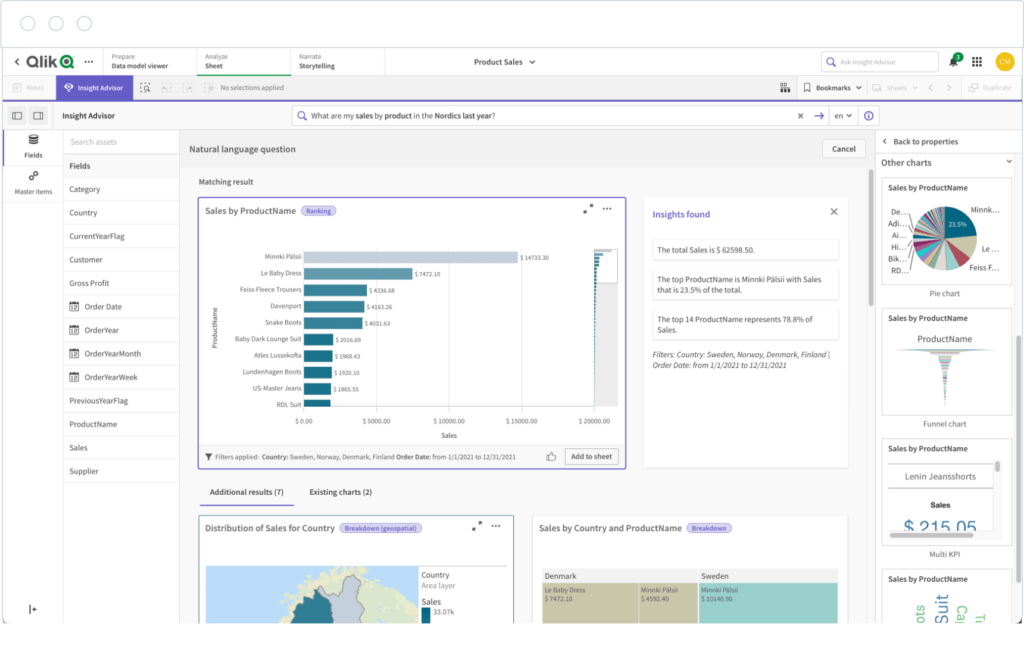
Qlik Cloud Analytics ranks third because its Associative Engine supports a distinctive style of data exploration. Rather than limiting users to predetermined drill paths, Qlik highlights relationships, selections, and excluded values across a data model, which can reveal patterns that conventional query-based dashboards miss.
Top Features:
- Associative Engine for flexible data discovery
- Qlik Answers for conversational and agentic analytics
- Predictive analytics, anomaly detection, and forecasting
- Dashboards, reporting, alerts, and application automation
- Cloud analytics plus client-managed Qlik Sense options
Why It Ranks Here:
Qlik has strengthened its AI experience through Qlik Answers, which combines governed analytics with natural-language interaction and can work with structured and unstructured information. It also offers more built-in data integration and automation than many visualization-first tools. The tradeoff is a steeper learning curve, capacity-based pricing, and the need to design data models carefully.
Best Use Case:
Qlik is best for organizations that need complex cross-source discovery, governed self-service analytics, predictive features, and an independent platform outside one cloud ecosystem. Read our full Qlik Sense review for a deeper analysis of features, pricing, limitations, and alternatives.
Pros and Cons:
Positives
✅ Powerful associative analysis
✅ Strong AI and automation
✅ Broad data integration
✅ Flexible cloud and on-premises options
Negatives
❌ Capacity pricing needs modeling
❌ Setup can be technical
❌ Learning curve is meaningful
❌ Data models require expertise
Sigma

Overview:
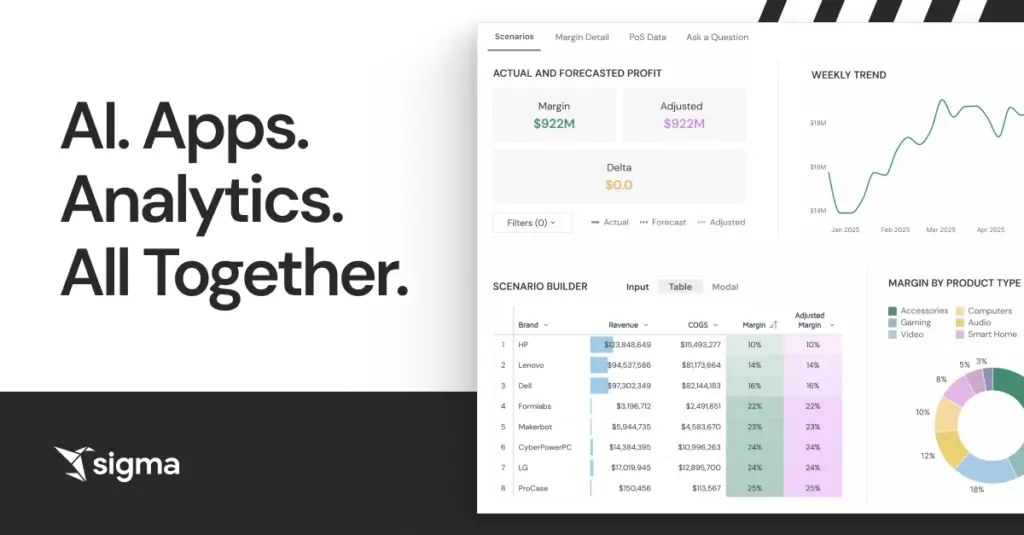
Sigma is the most compelling modern BI option for organizations that store data in Snowflake, Databricks, BigQuery, or another supported cloud platform and want business users to work with it through a familiar spreadsheet interface. It queries data in place rather than importing it into a separate proprietary engine.
Top Features:
- Spreadsheet formulas, pivots, and detailed record analysis
- Warehouse-native queries and source-level governance
- Ask Sigma, AI enrichment, and prompt-assisted building
- Input tables, forms, actions, and writeback
- Data applications and embedded analytics
Why It Ranks Here:
Sigma ranks above several established BI vendors because it closes the gap between dashboards and operational work. Teams can analyze data, enter forecasts, approve exceptions, update classifications, and trigger actions from the same workbook. Its AI toolkit can also classify, extract, summarize, and build on governed warehouse data. It is less suitable when you lack a modern cloud data platform or need predictable public pricing.
Best Use Case:
Sigma is best for finance, operations, revenue, and product teams that rely on spreadsheets but need controlled access to live warehouse data and actionable workflows. Read our full Sigma review for a deeper analysis of features, pricing, limitations, and alternatives.
Pros and Cons:
Positives
✅ Familiar spreadsheet interface
✅ Live warehouse-scale analysis
✅ Native writeback and actions
✅ Strong embedded analytics
Negatives
❌ Public pricing is unavailable
❌ Requires a modern data platform
❌ Queries add warehouse cost
❌ Advanced apps need governance
ThoughtSpot

Overview:
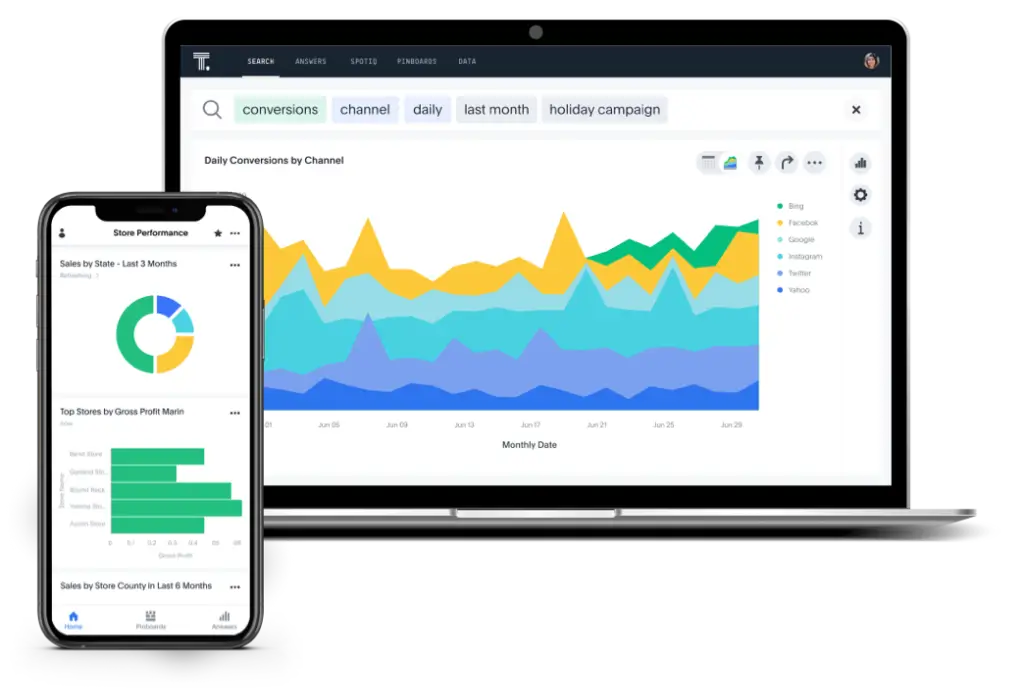
ThoughtSpot is the strongest option for organizations that want business users to ask questions in natural language instead of waiting for analysts to build another dashboard. Spotter acts as an AI analyst, while interactive Liveboards and editable search tokens let users refine results and inspect how a question was interpreted.
Top Features:
- Spotter AI Agent for multi-step conversational analysis
- Search tokens that make questions visible and editable
- Liveboards with open-ended drill-down
- Spotter Semantics for governed business definitions
- Analyst Studio and advanced embedded analytics
Why It Ranks Here:
ThoughtSpot has moved further toward agentic analytics with Spotter, Spotter Semantics, and visualization agents that can create governed charts and dashboards from natural-language requests. Its user experience can reduce routine reporting queues, but reliable answers still depend on curated data, approved metrics, synonyms, security rules, and warehouse performance.
Best Use Case:
ThoughtSpot is best for mid-market and enterprise teams with a mature cloud data foundation that want AI-driven self-service and customer-facing conversational analytics. Read our full ThoughtSpot review for a deeper analysis of features, pricing, limitations, and alternatives.
Pros and Cons:
Positives
✅ Excellent natural-language analytics
✅ Flexible Liveboard exploration
✅ Strong embedded analytics
✅ Governed AI foundation
Negatives
❌ Modeling effort remains significant
❌ Visual design is less flexible
❌ Usage costs need planning
❌ Live queries affect warehouse cost
Google Cloud Looker
Overview:
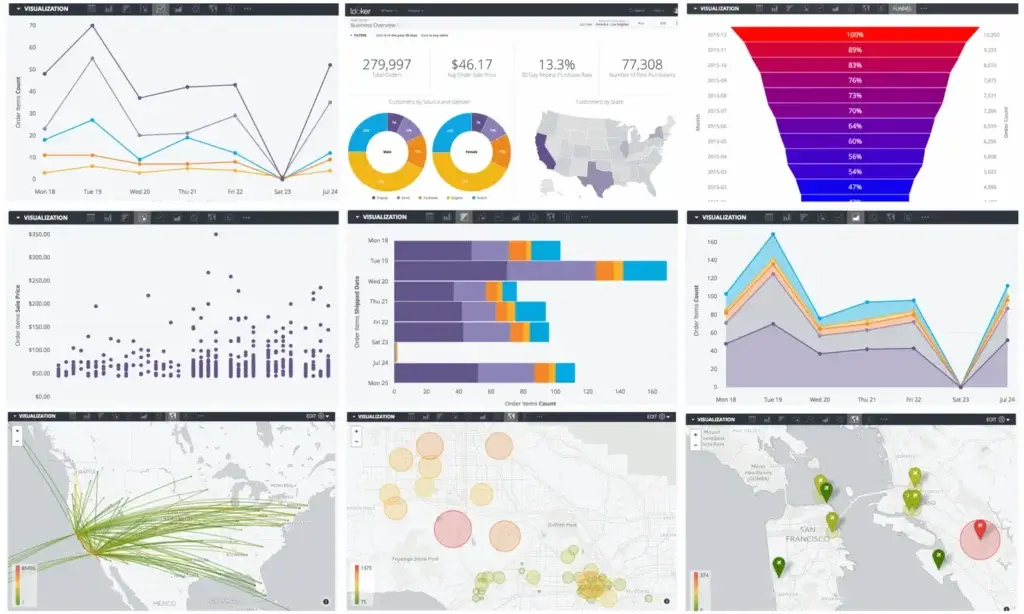
Looker is the best option when metric consistency, governed self-service, and embedded analytics matter more than rapid no-code dashboard creation. Its LookML modeling layer lets data teams define dimensions, measures, joins, access rules, and business logic once, then reuse those definitions across Explores, dashboards, APIs, and customer applications.
Top Features:
- Git-managed LookML semantic modeling
- Warehouse-native queries and governed Explores
- Gemini-powered conversational analytics and data agents
- APIs, SDKs, actions, and embedded analytics
- Strong Google Cloud and BigQuery integration
Why It Ranks Here:
Looker remains one of the most mature platforms for semantic governance. Gemini in Looker now supports conversational analytics, Explore summaries, natural-language LookML assistance, and agentic workflows, which makes the governed model more accessible to business users. It ranks sixth because implementation requires technical ownership, visualization is less flexible than Tableau, and pricing is not publicly transparent.
Best Use Case:
Looker is best for cloud-native data teams, Google Cloud customers, and SaaS companies that need reusable metrics and deeply embedded analytics. Read our full Looker review for a deeper analysis of features, pricing, limitations, and alternatives.
Pros and Cons:
Positives
✅ Excellent semantic governance
✅ Strong embedded capabilities
✅ Developer-friendly workflow
✅ Deep Google Cloud integration
Negatives
❌ LookML requires expertise
❌ Quote-based pricing
❌ Visualization is less flexible
❌ Warehouse performance matters
Domo

Overview:
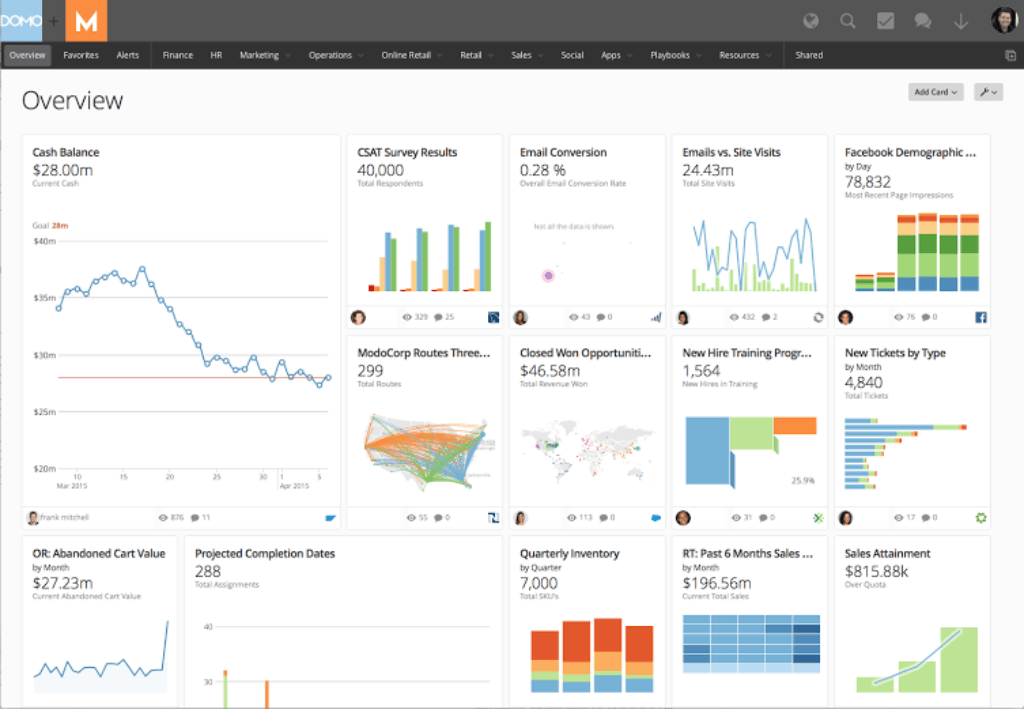
Domo ranks seventh because it offers more than conventional dashboarding. The platform combines connectors, visual data preparation, analytics, low-code applications, workflow automation, embedded experiences, mobile access, and governed AI inside one connected environment.
Top Features:
- More than 1,000 data connectors and Magic ETL
- Interactive dashboards, alerts, and mobile analytics
- App Studio, App Catalyst, and workflow automation
- Domo.AI, AI Chat, and Agent Catalyst
- Embedded analytics and a shared semantic layer
Why It Ranks Here:
Domo is particularly useful when you want to operationalize data rather than publish static reports. Recent platform development has emphasized governed AI agents, job-specific apps, spreadsheet-like Worksheets, and a semantic layer that supports both self-service BI and AI. The main concern is cost predictability because pricing is quote-based and credit consumption can span ingestion, storage, transformation, workflows, and AI activity.
Best Use Case:
Domo is best for mid-sized and enterprise organizations that want one platform for data integration, BI, applications, automation, and executive mobile reporting. Read our full Domo review for a deeper analysis of features, pricing, limitations, and alternatives.
Pros and Cons:
Positives
✅ Broad all-in-one platform
✅ Strong connectors and ETL
✅ Useful apps and workflows
✅ Governed AI agent tools
Negatives
❌ Credit pricing can be complex
❌ May be excessive for basic BI
❌ Requires governance and ownership
❌ Public pricing is limited
Databox

Overview:
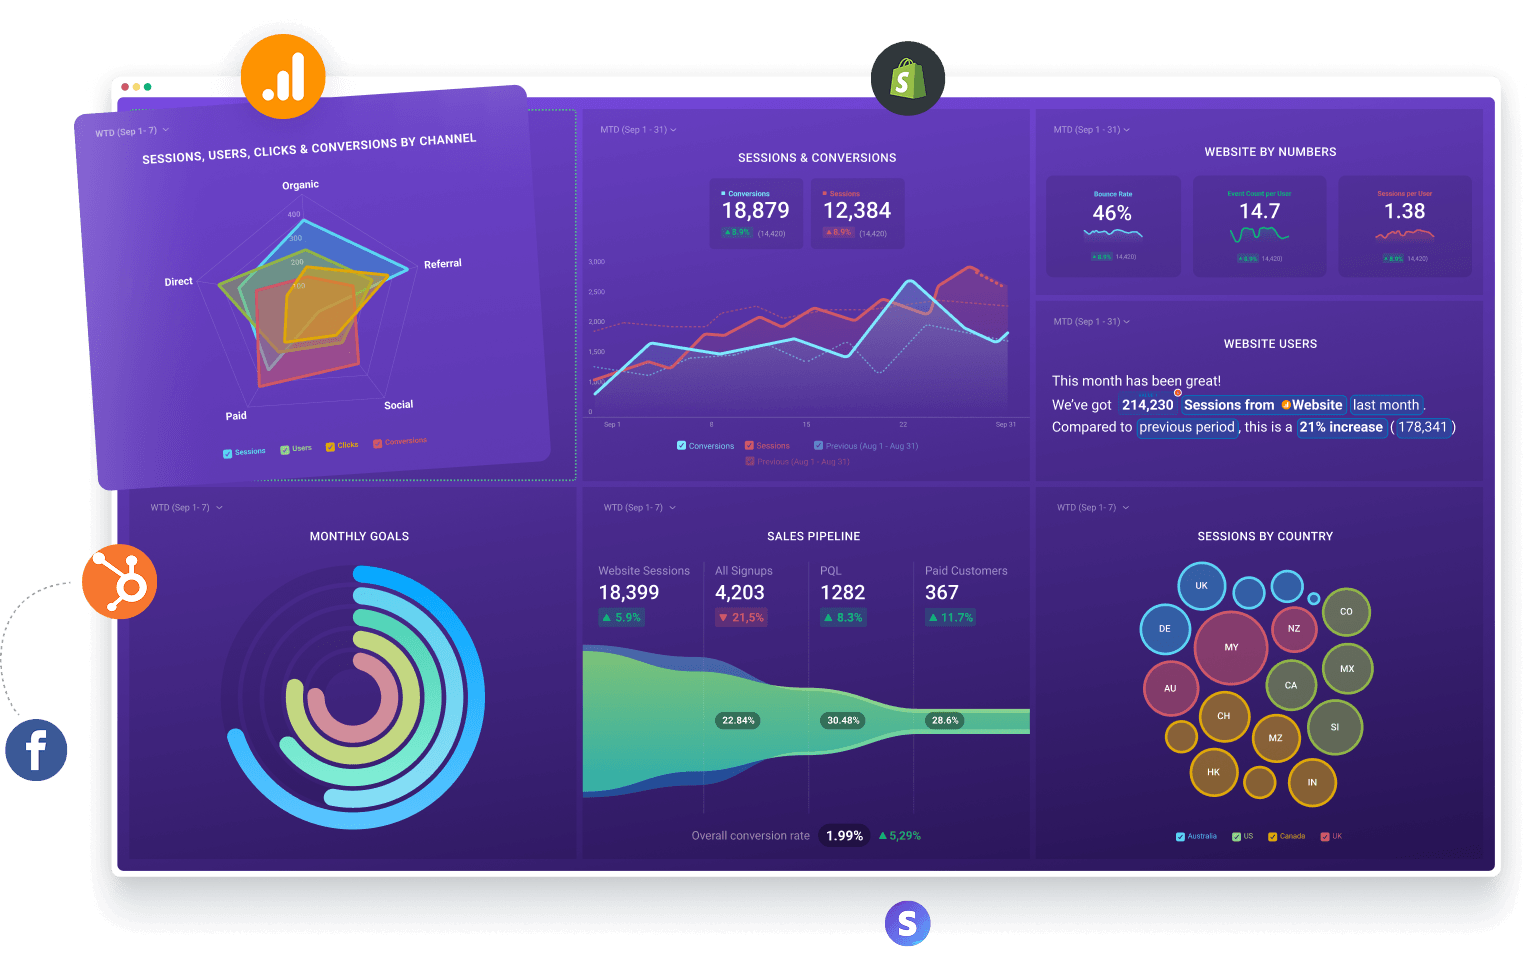
Databox ranks eighth as the most accessible option for teams that need to connect common business systems, standardize KPIs, automate recurring reporting, and answer performance questions without deploying a traditional enterprise BI stack. It combines dashboards, reports, custom metrics, datasets, goals, OKRs, forecasts, and AI-assisted analysis in a no-code environment designed for business users.
Top Features:
- Genie AI Analyst for conversational performance analysis
- More than 130 native integrations plus databases, spreadsheets, and APIs
- Interactive dashboards, automated reports, alerts, and scorecards
- Datasets, custom metrics, anomaly detection, and forecasting
- Databox MCP for connecting trusted metrics to compatible AI tools
Why It Ranks Here:
Databox delivers faster time to value than most traditional enterprise BI platforms. You can connect widely used marketing, sales, finance, ecommerce, and analytics applications without building a separate data pipeline. Genie can answer performance questions and help create metrics or dashboards from prompts, while the Databox MCP server makes governed performance data available inside compatible AI and automation tools.
It ranks eighth because its advanced data modeling, visualization flexibility, semantic governance, and large-scale analytical capabilities are less extensive than those of Power BI, Tableau, Qlik, Sigma, ThoughtSpot, Looker, and Domo. Costs can also increase as you add data-source connections, AI usage, advanced security, white-labeling, and faster data synchronization.
Best Use Case:
Databox is best for SaaS companies, agencies, executives, marketers, sales leaders, and operations teams that want to consolidate KPIs from multiple business applications without relying heavily on data engineers. It is especially useful when fast setup, automated stakeholder reporting, and accessible performance monitoring matter more than highly customized enterprise analytics.
Pros and Cons:
Positives
✅ Fast no-code dashboard setup
✅ Broad business app integrations
✅ Accessible Genie AI analysis
✅ Strong automated reporting
Negatives
❌ Less advanced semantic modeling
❌ Included data sources are limited
❌ AI usage is credit-based
❌ Enterprise customization is narrower
Business Intelligence Software Pricing Compared
BI pricing is rarely a simple seat calculation. You may pay for creators, viewers, capacity, data volume, warehouse compute, refresh activity, embedded usage, AI queries, premium support, and implementation. Compare the full deployment model rather than the lowest advertised plan.
| Platform | Pricing Model | Cost Consideration |
| Power BI | Free desktop, per-user, Fabric capacity | Excellent entry value, but sharing, capacity, and Copilot increase complexity |
| Tableau | Role-based per-user licensing | Viewer, Explorer, and Creator roles simplify planning but cost more than Power BI at scale |
| Qlik Cloud Analytics | User-based Starter and capacity-based higher tiers | Data-for-analysis capacity must match expected workloads |
| Sigma | Custom role and usage-based quote | Include warehouse compute and data-platform costs |
| ThoughtSpot | Per-user, per-query, and custom enterprise options | Model AI query volume, users, data scale, and warehouse activity |
| Looker | Custom annual platform and user quote | Implementation and LookML ownership are major parts of total cost |
| Domo | Custom credit-based pricing | Credits may cover ingestion, storage, transformations, workflows, and AI |
How to Choose Business Intelligence Software
Start With the Decision, Not the Dashboard
Define the business decisions the platform must improve. Executive reporting, financial planning, product analytics, embedded customer dashboards, supply-chain monitoring, and ad hoc exploration require different workflows. A proof of concept should test real questions, real data, and real users rather than a polished vendor demo.
Match the Platform to Your Data Architecture
Power BI can import data, query sources directly, or use Direct Lake with Microsoft Fabric. Tableau supports extracts and live connections. Sigma, Looker, and ThoughtSpot are strongest when a modern warehouse or lakehouse already holds curated data. Domo can ingest and transform data inside its own environment, while Qlik can combine analytics with broader integration capabilities.
Evaluate the Semantic Layer and Metric Governance
AI does not solve inconsistent definitions. Before comparing chatbot quality, determine how each platform defines revenue, active customers, gross margin, fiscal periods, pipeline stages, and other shared metrics. Looker is particularly strong for code-managed semantics, while Power BI, Qlik, Sigma, ThoughtSpot, Tableau, and Domo provide different approaches to governed models and business definitions.
Test AI With Difficult Business Questions
Most leading business intelligence platforms now offer conversational analytics, summaries, anomaly detection, forecasting, or agents. The useful question is not whether a vendor has AI, but whether the AI is grounded in approved data and produces explainable, repeatable answers.
During the pilot, test multi-step questions, ambiguous language, generated calculations, security, and any premium capacity or usage requirements.
Measure Ease of Use by Role
A platform can be easy for viewers and difficult for builders. Power BI business users may navigate reports quickly while creators learn DAX and data modeling. ThoughtSpot users may find search intuitive while administrators invest heavily in semantic preparation. Sigma is familiar to spreadsheet users, but production apps still need governance. Looker is powerful after LookML models are built, not before.
Evaluate each user role separately because viewing, building, modeling, and administering BI require different skills.
Calculate Total Cost of Ownership
Include licenses, data infrastructure, implementation, training, support, embedded usage, AI consumption, and model maintenance. A higher-priced platform may still cost less when it replaces several separate tools.
Run a Focused Proof of Concept
Choose one high-value domain such as sales, finance, customer success, or operations. Connect representative data, define trusted metrics, build one executive view, enable ad hoc exploration, apply security, and measure performance with realistic concurrency.
- Can users answer both planned and unplanned questions?
- Do dashboards and AI answers use the same metric definitions?
- Can administrators trace data lineage and manage access?
- Does performance remain acceptable with real data volumes?
- Can you estimate the full monthly and annual cost?
Types of Business Intelligence Platforms
Self-Service BI
Self-service BI helps business users explore governed data with less analyst support, although every platform requires a different level of preparation.
Visualization-First BI
Visualization-first tools emphasize interactive charts and analytical storytelling. Tableau leads, while Power BI adds deeper Microsoft modeling and distribution.
Warehouse-Native and Semantic-Layer BI
Sigma, Looker, and ThoughtSpot suit organizations with curated warehouse data and a need for live queries or governed business logic.
Operational and Embedded Analytics
Domo, Sigma, Looker, and ThoughtSpot extend analytics into applications, embedded experiences, and operational workflows.
Other BI Platforms Worth Considering
The seven tools above provide the strongest overall mix for most evaluations, but several alternatives deserve consideration for specific requirements.
- Pyramid Analytics: A capable decision intelligence platform for governed self-service analytics, data science, and enterprise deployments.
- Metabase: A practical open-source option for straightforward dashboards, SQL exploration, and smaller teams that value faster deployment.
- SAP Analytics Cloud: A better modern shortlist candidate than SAP BusinessObjects when your organization is deeply invested in SAP planning, analytics, and enterprise applications.
- Sisense: A strong embedded analytics option for software companies and teams that need customizable analytics inside customer-facing products.
Conclusion
Microsoft Power BI is the best business intelligence software overall for 2026 because it combines strong modeling, broad integration, scalable governance, competitive entry pricing, and a rapidly improving Fabric and Copilot ecosystem. Tableau is the better choice when visual exploration leads the buying decision, while Qlik stands out for associative discovery and integrated analytics.
Sigma is the strongest modern option for spreadsheet-oriented teams working on live warehouse data. ThoughtSpot leads in conversational analytics, Looker provides the most disciplined developer-led semantic layer, and Domo is well suited to organizations that want BI, data integration, applications, workflows, and AI in one environment.
The best result comes from matching the platform to your architecture and operating model. Test trusted metrics, AI reliability, performance, security, adoption, and total cost with a focused proof of concept before making a long-term commitment.
FAQs
What is the best business intelligence software?
Microsoft Power BI is the best overall business intelligence software for most organizations because it combines data preparation, semantic modeling, dashboards, governance, Microsoft integration, and competitive entry pricing. Tableau, Qlik, Sigma, ThoughtSpot, Looker, and Domo may be better for specialized needs.
What is business intelligence software?
Business intelligence software connects, prepares, models, analyzes, and visualizes business data. Modern BI platforms also support governed metrics, natural-language questions, automated insights, forecasting, embedded analytics, and workflow automation.
Which BI tool is best for small businesses?
Power BI is often the best BI tool for small businesses that use Microsoft products because Power BI Desktop is free and Pro licensing has a relatively accessible entry point. Metabase can also suit smaller technical teams that want an open-source option.
Which business intelligence platform has the best data visualization?
Tableau is the strongest platform for flexible data visualization and visual exploration. It gives analysts extensive control over interactive dashboards, charts, calculations, maps, and analytical storytelling.
Which BI software is best for AI analytics?
ThoughtSpot is particularly strong for conversational analytics through Spotter, while Qlik Answers, Tableau Agent, Power BI Copilot, Gemini in Looker, Sigma AI, and Domo AI provide different combinations of natural-language analysis, automated insights, and agentic workflows.
What is the difference between Power BI and Tableau?
Power BI is stronger for Microsoft integration, data modeling, DAX, and lower-cost entry licensing. Tableau is stronger for fluid visual exploration, dashboard design, and analytical storytelling. The better choice depends on your ecosystem and reporting style.
Do BI tools require a data warehouse?
Not always. Power BI, Tableau, Qlik, and Domo can work with many files, databases, and applications. Sigma, Looker, and ThoughtSpot deliver their strongest value when a cloud warehouse or lakehouse already contains curated, governed data.
How much does business intelligence software cost?
BI pricing ranges from free desktop tools to enterprise contracts worth thousands per month. Total cost can include creators, viewers, capacity, data volume, warehouse compute, AI usage, implementation, support, training, and governance.
What features should you look for in BI software?
Prioritize data connectivity, semantic modeling, dashboard flexibility, self-service exploration, AI explainability, security, row-level access, embedded options, performance, collaboration, administration, and a pricing model you can forecast.
How should you test a BI platform before buying?
Run a focused proof of concept with real data, approved metrics, representative users, security rules, realistic data volumes, and difficult business questions. Test dashboard creation, ad hoc analysis, AI answers, performance, governance, and total expected cost.