Introduction
Manufacturing KPIs help you understand whether your production floor is running efficiently, reliably, and profitably. Without the right key performance indicators, it is easy to track a lot of data but still miss the problems that actually affect output, quality, delivery, and margins.
That is a common issue in manufacturing. You may know how many orders were completed last week, but not why one work center keeps slowing down production. You may see that labor costs are rising, but not whether the root cause is poor scheduling, downtime, rework, material shortages, or low throughput. You may also have reports in your ERP, MRP, MES, spreadsheets, and maintenance system, but no clear KPI structure that helps your team make better decisions.
This guide explains the most important manufacturing KPIs to track in 2026, including production efficiency, quality, maintenance, inventory, delivery, and cost metrics. You will also see practical formulas, dashboard examples, common mistakes, and tips for choosing the right KPIs for your operation.
The goal is not to track every possible manufacturing metric. The goal is to build a focused KPI system that helps you improve production performance, reduce waste, control costs, and make better operational decisions.
What Are Manufacturing KPIs?
Manufacturing KPIs are measurable performance indicators used to evaluate how well a manufacturing operation is performing. They help you monitor areas such as production output, machine performance, product quality, material usage, maintenance reliability, inventory control, delivery performance, and production cost.
A good manufacturing KPI should connect directly to a business goal. For example, if your goal is to increase output without adding more labor or machines, you may track OEE, throughput, cycle time, capacity utilization, and schedule adherence. If your goal is to reduce waste, you may focus on scrap rate, first pass yield, defect rate, rework rate, and material yield.
The ISO 22400 standard is one useful reference point because it defines KPIs used in manufacturing operations management and presents them with formulas, units, time behavior, and other characteristics. In practice, however, your KPI system should be shaped by your production model, industry, product complexity, and improvement priorities.
Manufacturing KPIs vs manufacturing metrics
The terms KPI and metric are often used together, but they are not exactly the same. A metric is any measurable data point. A KPI is a metric that is important enough to help evaluate progress toward a specific business objective.
For example, machine runtime is a metric. OEE becomes a KPI when you use it to measure how effectively equipment is being used and to guide improvement work. Units produced is a metric. Throughput becomes a KPI when you use it to evaluate whether production is meeting demand.
This distinction matters because manufacturing teams can easily become overloaded with reports. The strongest KPI systems focus on the few metrics that help managers and operators make better decisions.
Why manufacturing KPIs matter
Manufacturing KPIs matter because they turn production data into operational visibility. They help you see where work is flowing well, where performance is slipping, and where improvement efforts will have the biggest financial impact.
According to NIST research on manufacturing KPIs, key performance indicators are critical for manufacturing operations management and continuous improvement because they reflect performance across areas such as efficiency, throughput, availability, productivity, quality, and maintenance.
For manufacturers, this visibility is especially important because small production issues can quickly become expensive. A machine that stops too often can delay orders. A small increase in scrap can hurt margins. A poor schedule can create overtime, idle labor, and late deliveries. A missing material can stop production even when machines and employees are available.
Manufacturing KPI Categories at a Glance
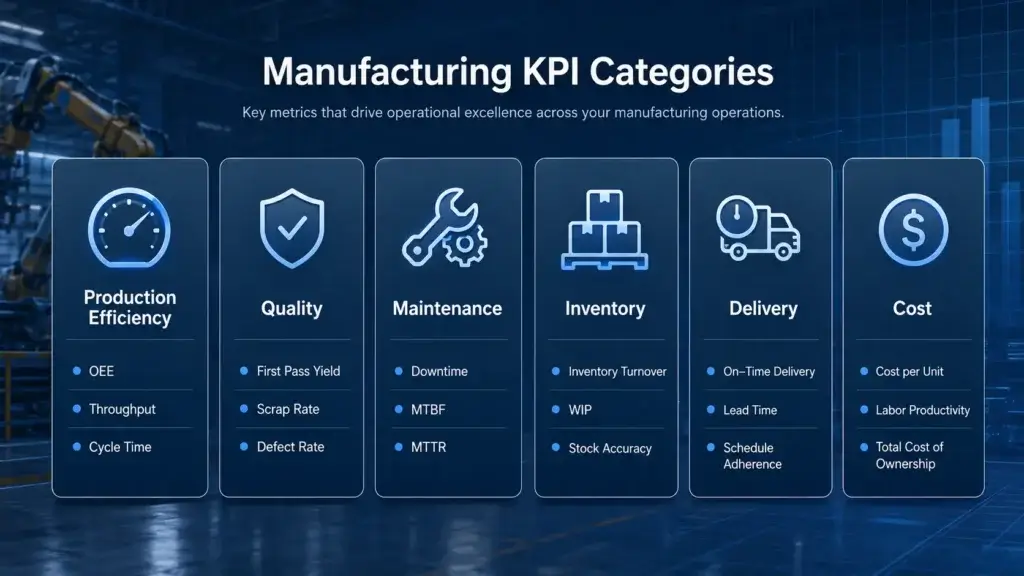
The best way to organize manufacturing KPIs is by the type of decision they support. This makes the data easier to understand and prevents your dashboard from becoming a long list of disconnected numbers.
Most manufacturers should group KPIs into six main categories: production efficiency, quality, maintenance, inventory, delivery, and cost. Each category answers a different operational question.
| KPI Category | What It Measures | Example KPIs |
| Production efficiency | How effectively production resources are converted into output | OEE, throughput, cycle time, capacity utilization |
| Quality | How often products meet specifications without defects or rework | First pass yield, scrap rate, defect rate, rework rate |
| Maintenance | How reliable equipment is and how quickly issues are resolved | Downtime, MTBF, MTTR, preventive maintenance compliance |
| Inventory | How well materials, WIP, and finished goods are controlled | Inventory turnover, WIP inventory, stockout rate, supplier lead time |
| Delivery | How reliably production meets customer or internal deadlines | On-time delivery, manufacturing lead time, order accuracy |
| Cost | How efficiently production turns resources into profitable output | Cost per unit, labor productivity, maintenance cost per unit |
This category-based approach is useful because each team can focus on the KPIs that match its responsibilities. Executives may need cost, delivery, and high-level efficiency KPIs. Plant managers may need throughput, downtime, quality, and schedule adherence. Maintenance teams may need MTBF, MTTR, downtime, and preventive maintenance compliance.
25 Essential Manufacturing KPIs to Track
The right manufacturing KPIs depend on your business model, but the following 25 metrics are among the most useful for production teams, operations leaders, and manufacturing executives.
You do not need to track all of them from day one. A smaller manufacturer may start with 8 to 12 core KPIs, while a larger manufacturer may build role-specific dashboards for production, quality, maintenance, inventory, and finance.
Production efficiency KPIs
Production efficiency KPIs help you understand how effectively your plant converts available time, labor, machines, and materials into finished output. These metrics are especially important when you want to improve capacity, reduce bottlenecks, and produce more without automatically adding new resources.
1. Overall Equipment Effectiveness, OEE
Overall Equipment Effectiveness, or OEE, is one of the most widely used manufacturing KPIs. It measures how effectively equipment is being used by combining availability, performance, and quality into one percentage.
Formula: OEE = Availability × Performance × Quality
Availability measures whether equipment was running when it was supposed to run. Performance measures whether it ran at the expected speed. Quality measures whether the output was good enough to meet requirements.
OEE is useful because it helps you find hidden losses. A low OEE score may be caused by downtime, slow cycles, minor stops, defects, startup losses, or poor changeover performance. You can learn more about the standard OEE formula from OEE.com.
2. Throughput
Throughput measures how many units, batches, or jobs your operation completes during a defined period. It is one of the simplest ways to understand actual production output.
Formula: Throughput = Units Produced ÷ Time Period
For example, if a production line produces 4,000 units during an 8-hour shift, its throughput is 500 units per hour. Tracking throughput over time helps you identify changes in capacity, staffing performance, machine output, and demand readiness.
3. Cycle Time
Cycle time measures how long it takes to complete one production cycle, one unit, or one process step. It is especially useful for finding bottlenecks and improving flow.
Formula: Cycle Time = Total Production Time ÷ Number of Units Produced
If cycle time increases, it may mean a process is slowing down because of machine issues, operator delays, material shortages, poor layout, quality checks, or setup problems. Reducing cycle time can improve throughput and delivery speed, but it should not come at the expense of product quality.
4. Capacity Utilization
Capacity utilization measures how much of your available production capacity is actually being used. It helps you understand whether your plant is underused, overloaded, or operating near its practical limit.
Formula: Capacity Utilization = Actual Output ÷ Maximum Possible Output × 100
A low rate may point to weak demand, poor scheduling, material shortages, or too much idle capacity. A very high rate may sound positive, but it can also create risks if there is no room for rush orders, maintenance, changeovers, or demand spikes.
5. Schedule Adherence
Schedule adherence measures how closely actual production follows the planned production schedule. This is an important KPI for manufacturers that depend on accurate sequencing, customer deadlines, and material availability.
Formula: Schedule Adherence = Completed Scheduled Production ÷ Planned Scheduled Production × 100
If schedule adherence is low, your team may be dealing with unrealistic planning, inaccurate lead times, missing materials, machine constraints, poor labor allocation, or too many urgent changes. This KPI is especially useful when paired with production scheduling software and MRP data.
Quality KPIs in Manufacturing
Quality KPIs show whether production output meets required specifications the first time. These metrics are essential because quality problems affect cost, delivery, customer satisfaction, and brand reputation.
In many manufacturing environments, poor quality does not only create rejected products. It also creates inspection work, rework, scrap, warranty claims, customer complaints, and production delays.
6. First Pass Yield
First pass yield measures the percentage of products that are completed correctly without rework, repair, or additional processing. It is one of the clearest indicators of process quality.
Formula: First Pass Yield = Good Units Produced Without Rework ÷ Total Units Started × 100
A high first pass yield means your process is producing acceptable output the first time. A low first pass yield suggests defects, inconsistent processes, operator errors, poor materials, unclear work instructions, or equipment issues.
7. Scrap Rate
Scrap rate measures the percentage of materials or finished units that cannot be used, reworked, or sold. This KPI is directly connected to waste and production cost.
Formula: Scrap Rate = Scrapped Units ÷ Total Units Produced × 100
Scrap is expensive because it consumes materials, labor, machine time, energy, and capacity without producing sellable output. Tracking scrap rate by product, line, shift, supplier, or work center can help you find the real source of waste.
8. Defect Rate
Defect rate measures the percentage of units that fail to meet quality standards. Unlike scrap rate, defect rate may include products that can be reworked or corrected.
Formula: Defect Rate = Defective Units ÷ Total Units Inspected × 100
This KPI is useful for identifying recurring quality issues, especially when you break defects down by type. For example, one line may have surface defects, another may have incorrect dimensions, and another may have packaging errors.
9. Rework Rate
Rework rate measures how much production must be corrected before it can be accepted or shipped. It is an important KPI because rework often hides the true cost of poor quality.
Formula: Rework Rate = Units Reworked ÷ Total Units Produced × 100
A product that is reworked may still be shipped, but it consumes extra labor, machine time, inspection time, and materials. High rework can also delay other jobs and reduce available capacity.
10. Cost of Poor Quality, COPQ
Cost of poor quality measures the financial impact of defects, scrap, rework, returns, warranty claims, inspections, and other quality failures.
Formula: COPQ = Internal Failure Costs + External Failure Costs + Appraisal and Quality-Related Costs
This KPI is valuable because it converts quality problems into financial language. Instead of only saying defect rate increased, you can show how much quality issues cost the business.
Maintenance and Reliability KPIs
Maintenance KPIs help you measure equipment reliability, downtime, repair speed, and preventive maintenance discipline. These KPIs are especially important in asset-heavy manufacturing environments where machine availability affects output and delivery performance.
When maintenance data is not tracked properly, teams often react to breakdowns instead of preventing them. A good KPI structure helps maintenance teams move from firefighting to reliability improvement.
11. Downtime
Downtime measures how much planned production time is lost because equipment is not running. It can include breakdowns, unplanned stops, setup delays, changeovers, material issues, or maintenance activity.
Formula: Downtime = Total Time Equipment Is Not Operating During Planned Production
Downtime should be tracked by reason code whenever possible. Without reason codes, you may know that downtime is high, but not whether the cause is mechanical failure, missing material, operator availability, setup time, or quality inspection.
12. Mean Time Between Failures, MTBF
Mean Time Between Failures, or MTBF, measures the average operating time between equipment failures. It is commonly used to evaluate asset reliability.
Formula: MTBF = Total Operating Time ÷ Number of Failures
A higher MTBF usually means the machine is more reliable. If MTBF decreases, your team may need better preventive maintenance, spare parts planning, operator training, equipment inspection, or root cause analysis.
13. Mean Time to Repair, MTTR
Mean Time to Repair, or MTTR, measures how long it takes to repair equipment after a failure. It shows how quickly the maintenance team can restore equipment to operating condition.
Formula: MTTR = Total Repair Time ÷ Number of Repairs
A high MTTR may point to poor troubleshooting, missing spare parts, limited technician availability, weak documentation, or difficult-to-service equipment. Lowering MTTR can improve uptime and reduce production disruption.
14. Preventive Maintenance Compliance
Preventive maintenance compliance measures whether planned maintenance tasks are completed on schedule. It helps you understand whether your maintenance program is being executed consistently.
Formula: PM Compliance = Preventive Maintenance Tasks Completed on Time ÷ Scheduled PM Tasks × 100
This KPI is important because skipped preventive maintenance can create future downtime, safety issues, equipment wear, and quality problems. It should be tracked alongside downtime and failure trends, not in isolation.
15. Maintenance Cost per Unit
Maintenance cost per unit shows how much maintenance expense is attached to each unit produced. It connects maintenance activity to production economics.
Formula: Maintenance Cost per Unit = Total Maintenance Cost ÷ Units Produced
If maintenance cost per unit rises, it may mean equipment is aging, failures are becoming more frequent, repair costs are increasing, or production volume is too low to absorb fixed maintenance costs efficiently.
Inventory and Material KPIs
Inventory KPIs help manufacturers control raw materials, work-in-progress, finished goods, and supplier performance. These metrics are important because inventory affects production continuity, cash flow, storage costs, and customer delivery.
For manufacturers, inventory is more complex than simple stock tracking. You need enough materials to keep production moving, but not so much that cash is tied up in excess inventory, obsolete stock, or slow-moving components.
16. Inventory Turnover
Inventory turnover measures how often inventory is sold, used, or replaced during a period. It helps you evaluate whether inventory is moving efficiently.
Formula: Inventory Turnover = Cost of Goods Sold ÷ Average Inventory
A low turnover rate may indicate overstocking, poor demand planning, slow-moving items, or obsolete materials. A very high rate may indicate lean inventory control, but it can also increase stockout risk if supplier lead times are unreliable.
17. Work-in-Progress Inventory
Work-in-progress inventory, or WIP, measures the value or quantity of unfinished goods currently moving through production. It is an important KPI because high WIP can hide bottlenecks and slow cash conversion.
Formula: WIP Inventory = Value or Quantity of Unfinished Goods in Production
If WIP keeps growing, work may be entering production faster than it can be completed. This can create congestion, longer lead times, higher handling costs, and poor visibility into true production status.
18. Stockout Rate
Stockout rate measures how often required materials, components, or finished goods are unavailable when needed.
Formula: Stockout Rate = Stockout Events ÷ Total Demand Events × 100
In manufacturing, a stockout can stop a production order, delay a shipment, or force an expensive rush purchase. Tracking stockouts by supplier, material, product family, and cause can help you improve purchasing and planning.
19. Supplier Lead Time
Supplier lead time measures how long it takes suppliers to deliver required materials after an order is placed.
Formula: Supplier Lead Time = Delivery Date – Purchase Order Date
This KPI is critical for MRP planning because inaccurate supplier lead times can create unrealistic production schedules. If supplier lead times vary widely, you may need safety stock, alternative suppliers, or better demand planning.
20. Material Yield
Material yield measures how efficiently raw materials are converted into usable finished goods. It is especially useful in industries where material waste has a major cost impact.
Formula: Material Yield = Usable Output ÷ Material Input × 100
Low material yield may point to scrap, poor cutting plans, inaccurate recipes, equipment problems, operator errors, or low-quality materials. Improving material yield can reduce cost without requiring more sales volume.
Delivery and Fulfillment KPIs
Delivery KPIs measure whether your manufacturing operation can meet customer commitments and internal production deadlines. These KPIs are closely connected to scheduling, inventory accuracy, capacity planning, quality, and shop floor execution.
Even if production efficiency looks strong, late deliveries can still hurt customer trust. That is why delivery metrics should be included in any manufacturing KPI dashboard.
21. On-Time Delivery
On-time delivery measures the percentage of orders delivered by the promised date. It is one of the most important customer-facing manufacturing KPIs.
Formula: On-Time Delivery = Orders Delivered on Time ÷ Total Orders Delivered × 100
If on-time delivery is falling, the root cause may be inaccurate scheduling, stockouts, machine downtime, rework, poor supplier performance, unrealistic promises, or slow fulfillment.
22. Manufacturing Lead Time
Manufacturing lead time measures the total time required to produce an item, from production release to completion. It helps you understand how long work actually takes to move through the production system.
Formula: Manufacturing Lead Time = Production Completion Date – Production Start Date
Long lead times may be caused by queue time, batch size, bottlenecks, setup delays, inspection delays, missing materials, or too much WIP. Reducing lead time can improve responsiveness and customer satisfaction.
23. Order Fulfillment Accuracy
Order fulfillment accuracy measures whether customers receive the correct products, quantities, documentation, and packaging.
Formula: Order Fulfillment Accuracy = Accurate Orders ÷ Total Orders Shipped × 100
This KPI is especially important for manufacturers with complex SKUs, configurable products, multi-location warehouses, or strict compliance documentation. Errors can create returns, credits, customer complaints, and extra shipping costs.
Cost and Profitability KPIs
Cost KPIs help you understand whether production is financially efficient. These metrics are especially important when material prices, labor costs, energy costs, and customer expectations are putting pressure on margins.
A manufacturing operation can appear productive while still losing margin if quality costs, overtime, maintenance, material waste, or inventory carrying costs are too high.
24. Cost per Unit
Cost per unit measures the average cost to produce one finished unit. It is one of the most important manufacturing KPIs for profitability analysis.
Formula: Cost per Unit = Total Production Cost ÷ Units Produced
Total production cost may include materials, labor, overhead, machine costs, energy, maintenance, and quality-related costs. Tracking cost per unit by product, production line, batch, and time period can help you find margin leaks.
25. Labor Productivity
Labor productivity measures how much output is produced per labor hour, employee, shift, or team. It helps you evaluate how effectively labor is being converted into production output.
Formula: Labor Productivity = Units Produced ÷ Labor Hours
Low labor productivity does not always mean employees are underperforming. It may be caused by poor scheduling, missing materials, unclear instructions, downtime, rework, excessive movement, or manual processes that should be automated.
Manufacturing KPI Formulas Table
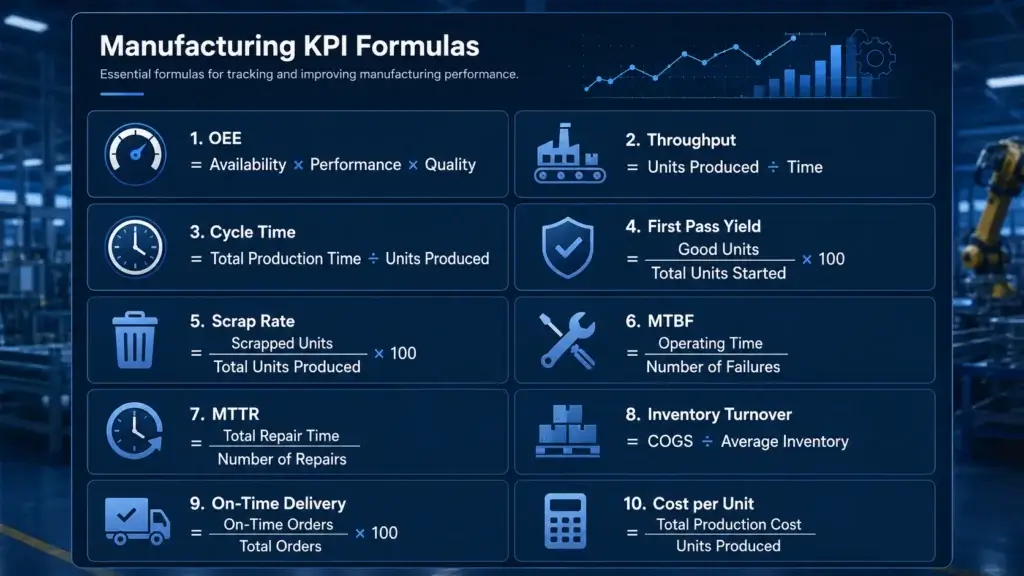
A formula table is useful because it gives production managers, operations teams, and executives a quick reference for the most common manufacturing KPIs. Use this table as a starting point, then adapt formulas to match how your business defines production time, good units, defects, cost, and delivery commitments.
| KPI | Formula | Why It Matters |
| OEE | Availability × Performance × Quality | Measures how effectively equipment is used |
| Throughput | Units Produced ÷ Time Period | Shows actual production output |
| Cycle Time | Total Production Time ÷ Units Produced | Helps identify bottlenecks and process delays |
| First Pass Yield | Good Units Without Rework ÷ Total Units Started × 100 | Measures how often production is right the first time |
| Scrap Rate | Scrapped Units ÷ Total Units Produced × 100 | Tracks waste and material loss |
| Defect Rate | Defective Units ÷ Total Units Inspected × 100 | Shows how often products fail quality standards |
| MTBF | Total Operating Time ÷ Number of Failures | Measures equipment reliability |
| MTTR | Total Repair Time ÷ Number of Repairs | Measures repair speed after failures |
| Inventory Turnover | Cost of Goods Sold ÷ Average Inventory | Measures how efficiently inventory is used |
| On-Time Delivery | Orders Delivered on Time ÷ Total Orders Delivered × 100 | Measures delivery reliability |
| Cost per Unit | Total Production Cost ÷ Units Produced | Shows production cost efficiency |
The most important point is consistency. If your team changes formulas every month, KPI trends become unreliable. Define each KPI clearly, document the formula, assign an owner, and make sure the data source is trusted.
How to Choose the Right Manufacturing KPIs
Choosing the right manufacturing KPIs is just as important as calculating them correctly. Many manufacturers make the mistake of tracking every available metric because the data exists. That creates dashboards that look impressive but do not help teams act faster.
A better approach is to start with your operational goals, then choose KPIs that directly support those goals.
Start with the business goal
Every KPI should answer a business question. If the KPI does not help you make a better decision, it may not belong on the dashboard.
- To improve output, track OEE, throughput, cycle time, and capacity utilization.
- To reduce defects, track first pass yield, scrap rate, defect rate, and rework rate.
- To improve uptime, track downtime, MTBF, MTTR, and PM compliance.
- To reduce costs, track cost per unit, labor productivity, and material yield.
- To improve delivery, track on-time delivery, lead time, and schedule adherence.
This goal-first approach keeps your KPI system focused. It also helps different teams understand why each metric matters.
Match KPIs to the right role
Not every user needs the same KPI dashboard. Executives need high-level trends that connect operations to cost, revenue, delivery, and customer satisfaction. Plant managers need production performance, quality, downtime, and schedule visibility. Supervisors need shift-level data. Maintenance teams need equipment reliability and repair metrics.
If everyone sees the same dashboard, the information may be too broad to be useful. A better structure is to create role-based dashboards that show the right metrics at the right level of detail.
Balance leading and lagging indicators
Lagging indicators show what already happened. Examples include monthly cost per unit, on-time delivery, scrap cost, and total units produced. These are important, but they often show problems after the damage has already happened.
Leading indicators help you act earlier. Examples include downtime trend, schedule adherence, first pass yield, WIP inventory, supplier lead time, and preventive maintenance compliance. A strong KPI system should include both.
Avoid KPI overload
More KPIs do not automatically create better visibility. Too many KPIs can create confusion, slow decision-making, and encourage teams to report data instead of improving performance.
For most manufacturers, it is better to start with a focused set of core KPIs, then add more advanced metrics as your data quality improves. A practical starting point is 8 to 12 KPIs across production, quality, maintenance, delivery, and cost.
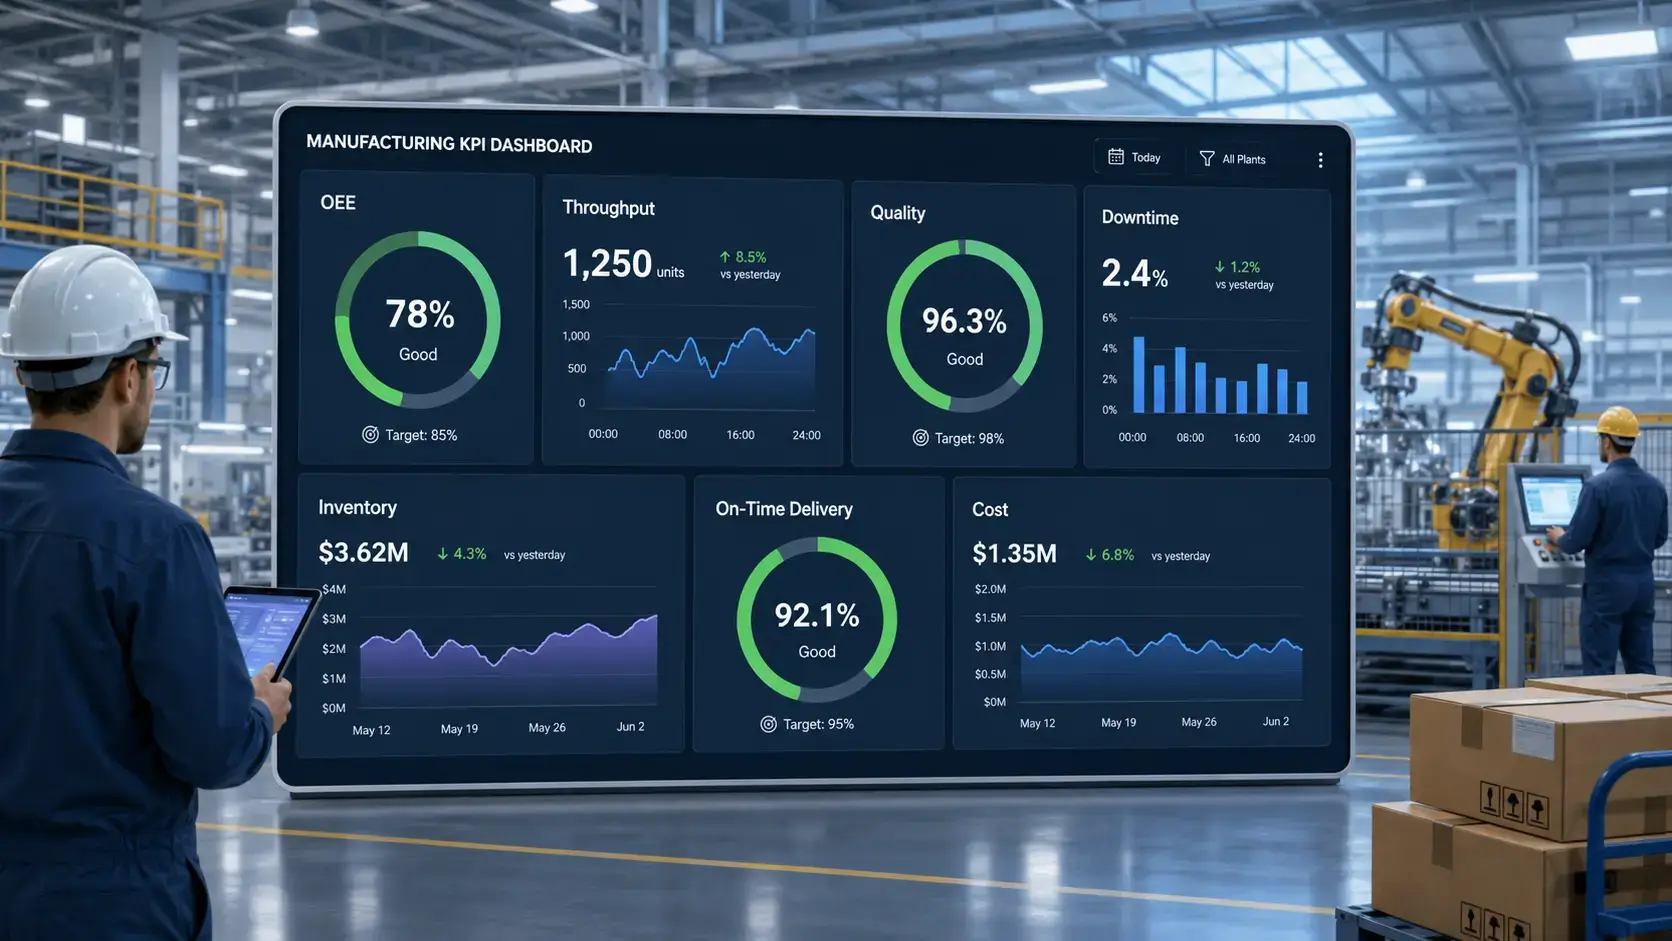
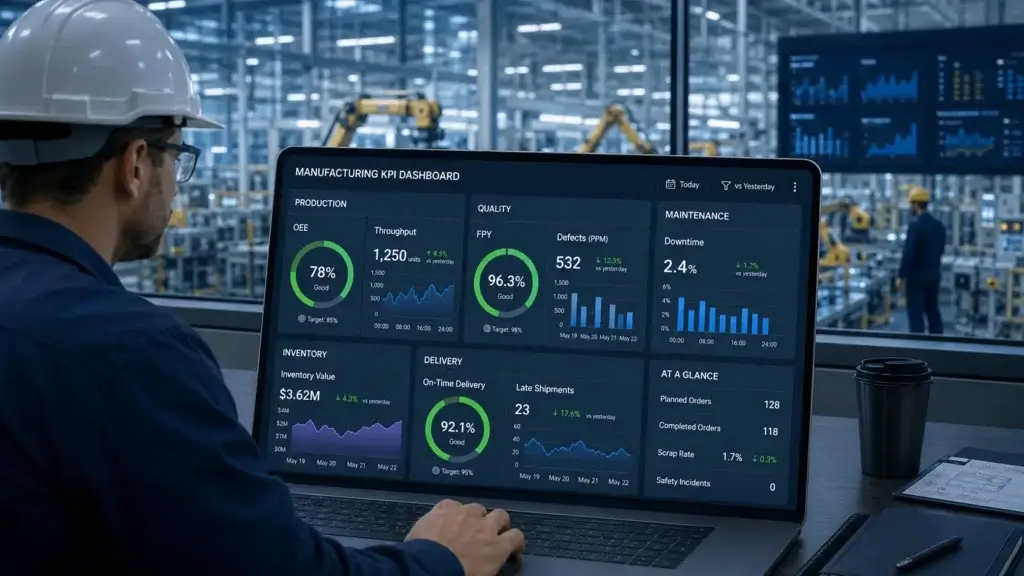
Manufacturing KPI Dashboard: What to Include
A manufacturing KPI dashboard should make performance easy to understand at a glance. It should not be a static report that people review once a month. The best dashboards help managers and operators see where action is needed now.
The right dashboard depends on your role, production model, and systems. A plant manager may need a daily production dashboard. An executive may need a monthly operational performance dashboard. A maintenance leader may need equipment-level reliability metrics.
Executive manufacturing dashboard
An executive dashboard should focus on high-level performance and financial impact. It should show whether the manufacturing operation is supporting business goals.
- OEE
- On-time delivery
- Cost per unit
- Inventory turnover
- Scrap cost
- Production volume
This dashboard should help leadership understand whether production performance is improving, whether customer commitments are being met, and whether margins are protected.
Plant manager dashboard
A plant manager dashboard should focus on daily and weekly operational control. It should show what is happening on the production floor and where performance is falling behind plan.
- Throughput
- Cycle time
- Schedule adherence
- Downtime
- First pass yield
- WIP inventory
This dashboard should help managers prioritize action, remove bottlenecks, and keep production moving.
Maintenance dashboard
A maintenance dashboard should help your team understand equipment reliability, repair speed, and preventive maintenance execution.
- Downtime by reason
- MTBF
- MTTR
- Preventive maintenance compliance
- Maintenance cost per unit
- Open maintenance work orders
This dashboard is especially useful when it connects maintenance events to production losses. That connection helps teams prioritize the assets that create the biggest operational risk.
Quality dashboard
A quality dashboard should show whether products are meeting standards and where defects are coming from.
- First pass yield
- Scrap rate
- Defect rate
- Rework rate
- Cost of poor quality
- Customer returns or complaints
This dashboard should help quality and production teams identify patterns by product, shift, operator, supplier, process step, or equipment.
| Dashboard Type | Best KPIs to Include | Main Decision It Supports |
| Executive dashboard | OEE, on-time delivery, cost per unit, inventory turnover, scrap cost | Are operations supporting profitability and customer commitments? |
| Plant manager dashboard | Throughput, cycle time, schedule adherence, downtime, first pass yield | Where should managers focus today? |
| Maintenance dashboard | Downtime, MTBF, MTTR, PM compliance, maintenance cost per unit | Which assets need reliability improvement? |
| Quality dashboard | First pass yield, scrap rate, defect rate, rework rate, COPQ | Where are defects and waste coming from? |
| Inventory dashboard | Inventory turnover, WIP, stockout rate, supplier lead time, material yield | Are materials supporting production without excess cost? |
Common Mistakes When Tracking Manufacturing KPIs
Manufacturing KPIs only create value when they are accurate, understood, and connected to action. If your team does not trust the data or does not know what to do with it, the dashboard becomes another report instead of a management tool.
Tracking too many KPIs
One of the most common mistakes is tracking too many KPIs at once. This usually happens when every department asks for its own metrics and no one prioritizes what matters most.
The result is a dashboard that looks complete but does not guide decisions. To avoid this, choose a small number of KPIs for each role and connect every KPI to a clear operational goal.
Using inconsistent formulas
If different teams calculate the same KPI in different ways, the data becomes difficult to compare. For example, one team may calculate downtime using only breakdowns, while another includes changeovers and material delays.
Before you build a dashboard, define each KPI clearly. Document the formula, data source, time period, owner, and update frequency.
Measuring results without root causes
A KPI can tell you that performance is poor, but it may not tell you why. For example, downtime is useful, but downtime by reason code is much more useful. Scrap rate is useful, but scrap rate by defect type, material, machine, or shift is better.
Whenever possible, connect high-level KPIs to root cause data. This helps your team move from reporting problems to solving them.
Relying on manual data entry
Spreadsheets can work for small teams, but manual KPI tracking often creates delays, errors, and version-control problems. If operators, supervisors, maintenance teams, and planners enter data inconsistently, the dashboard may not reflect reality.
As your operation grows, it becomes more important to connect KPIs to reliable systems such as MRP, ERP, MES, CMMS, inventory management software, production scheduling tools, and BI dashboards.
Not connecting KPIs to action
The biggest mistake is tracking KPIs without using them to improve operations. A KPI should trigger a question, decision, investigation, or improvement activity.
For example, if first pass yield drops, the team should investigate defect types, materials, operators, machines, and process changes. If schedule adherence falls, planners should review constraints, material availability, capacity, and order priorities.
Best Tools for Tracking Manufacturing KPIs
The right software depends on where your KPI data comes from. Some manufacturers can start with spreadsheets and simple dashboards, but growing manufacturers usually need connected systems to make KPI tracking accurate and scalable.
Manufacturing KPIs often depend on data from production orders, inventory transactions, machine events, quality checks, maintenance work orders, labor tracking, purchase orders, and shipments. If these data sources are disconnected, KPI reporting becomes slow and unreliable.
MRP systems
MRP systems help manufacturers track materials, production orders, bills of materials, purchasing, inventory, and demand planning. They are useful for KPIs such as material availability, WIP, production order status, stockout rate, supplier lead time, and schedule readiness.
If you are comparing systems, you can review our guide to the best MRP systems.
Manufacturing management software
Manufacturing management software can connect production planning, shop floor activity, inventory, quality, purchasing, and reporting. This makes it useful for broader KPI tracking across production, quality, inventory, and delivery.
You can compare options in our guide to manufacturing management software.
Manufacturing scheduling systems
Scheduling systems are useful when you need better visibility into production plans, work centers, labor, machines, constraints, changeovers, and due dates. They support KPIs such as schedule adherence, capacity utilization, lead time, on-time delivery, and bottleneck performance.
You can learn more in our guide to manufacturing scheduling systems.
Inventory management software
Inventory software helps track stock levels, warehouse movement, purchasing, sales orders, reorder points, and inventory value. It supports KPIs such as inventory turnover, stockout rate, WIP, material yield, and supplier performance.
You can compare tools in our guide to the best inventory management software.
ERP, MES, CMMS, and BI tools
ERP systems help connect manufacturing KPIs to finance, purchasing, sales, and business reporting. MES tools provide shop floor visibility and machine-level production data. CMMS platforms track maintenance work orders, preventive maintenance, equipment history, and downtime. BI tools help combine data from multiple systems into executive dashboards.
For many manufacturers, the best setup is not one tool replacing everything. It is a connected stack where each system captures accurate data and feeds the right KPIs into a dashboard.
How to Build a Better Manufacturing KPI Process
A good manufacturing KPI system is not only about choosing metrics. It is also about building a repeatable process for reviewing performance and improving operations.
If KPIs are reviewed inconsistently, they lose impact. If no one owns the metric, no one improves it. If the dashboard is updated too late, managers cannot act quickly enough.
Define each KPI clearly
Start by documenting the KPI name, formula, data source, owner, update frequency, target, and decision use. This prevents confusion and makes reporting more consistent.
For example, if you track downtime, define whether planned changeovers count as downtime. If you track on-time delivery, define whether the measurement is based on requested date, promised date, ship date, or delivery date.
Set realistic targets
KPI targets should be challenging but practical. If targets are unrealistic, teams may ignore them or manipulate the data. If targets are too easy, they will not drive improvement.
Use historical performance, customer expectations, industry benchmarks, equipment capacity, and financial goals to set targets. Then review them regularly as processes improve.
Review KPIs at the right cadence
Different KPIs require different review cycles. A supervisor may review hourly production output during a shift. A plant manager may review daily throughput, downtime, and quality. Executives may review monthly cost, delivery, and capacity trends.
The review cadence should match the speed at which the team can act. Real-time data is valuable for shop floor decisions, while monthly data may be enough for strategic planning.
Use KPIs to prioritize improvement work
KPIs should help your team decide where to focus. If downtime is the biggest constraint, maintenance reliability may be the priority. If scrap is increasing, quality improvement may come first. If on-time delivery is falling, scheduling and material planning may need attention.
The best manufacturers use KPIs as part of a continuous improvement rhythm. They review the data, identify root causes, assign owners, take action, and measure whether performance improves.
Conclusion
Manufacturing KPIs give you the visibility you need to improve production performance, reduce waste, protect margins, and build a more reliable operation. The key is not to track as many metrics as possible. The key is to track the right KPIs for the decisions you need to make.
For most manufacturers, the best KPI system includes a balanced mix of production efficiency, quality, maintenance, inventory, delivery, and cost metrics. OEE, throughput, cycle time, first pass yield, scrap rate, downtime, MTBF, MTTR, inventory turnover, on-time delivery, cost per unit, and labor productivity are strong starting points.
As your operation grows, your KPI process should become more connected. Spreadsheets may be enough at the beginning, but MRP systems, manufacturing management software, scheduling tools, inventory platforms, MES, CMMS, ERP, and BI dashboards can make KPI tracking faster, cleaner, and more actionable.
In 2026, the manufacturers that get the most value from KPIs will not be the ones with the most dashboards. They will be the ones that connect performance data to daily decisions, root cause analysis, and continuous improvement.
FAQs
What are manufacturing KPIs?
Manufacturing KPIs are measurable performance indicators used to track how well a manufacturing operation is performing. They usually cover production efficiency, quality, maintenance, inventory, delivery, and cost performance.
What are the most important manufacturing KPIs?
The most important manufacturing KPIs include OEE, throughput, cycle time, capacity utilization, first pass yield, scrap rate, defect rate, downtime, MTBF, MTTR, inventory turnover, on-time delivery, cost per unit, and labor productivity.
What is the difference between manufacturing KPIs and manufacturing metrics?
A manufacturing metric is any measurable data point, while a manufacturing KPI is a metric tied to a specific business goal. For example, machine runtime is a metric, while OEE is a KPI when it is used to improve equipment performance.
What is OEE in manufacturing?
OEE stands for Overall Equipment Effectiveness. It measures how effectively manufacturing equipment is used by combining availability, performance, and quality into one percentage.
How do you calculate OEE?
OEE is calculated by multiplying availability, performance, and quality. The formula is OEE = Availability × Performance × Quality. This helps manufacturers understand how much productive equipment time is actually producing good output.
What KPIs should a production manager track?
A production manager should usually track throughput, cycle time, OEE, schedule adherence, downtime, first pass yield, scrap rate, WIP inventory, and on-time delivery. These KPIs show whether production is meeting plan, quality, and delivery expectations.
What quality KPIs should manufacturers measure?
Manufacturers should measure quality KPIs such as first pass yield, scrap rate, defect rate, rework rate, cost of poor quality, customer returns, and complaint rate. These KPIs help identify where defects, waste, and rework are affecting performance.
What maintenance KPIs are important in manufacturing?
Important maintenance KPIs include downtime, MTBF, MTTR, preventive maintenance compliance, maintenance cost per unit, and open maintenance work orders. These KPIs help teams improve equipment reliability and reduce production disruption.
How many manufacturing KPIs should you track?
Most manufacturers should start with 8 to 12 core KPIs, then expand as data quality improves. Tracking too many KPIs can make dashboards harder to use, so each KPI should connect to a clear operational goal.
What software can track manufacturing KPIs?
Manufacturing KPIs can be tracked with MRP systems, ERP software, manufacturing management software, MES tools, CMMS platforms, inventory management software, production scheduling systems, and BI dashboards. The best choice depends on which data sources your operation needs to connect.