
Introduction
Databox is a business analytics and performance-management platform that brings metrics from marketing, sales, finance, ecommerce, CRM, spreadsheets, databases, and other business systems into one reporting environment.
Its main advantage is speed. Instead of building a warehouse, designing a detailed semantic model, and configuring a traditional business intelligence platform, you can connect supported applications, select pre-built metrics, customize dashboards, automate stakeholder reports, and begin monitoring performance relatively quickly.
That accessibility does not mean Databox is the right analytics platform for every organization. It is strongest when you need centralized KPI reporting, automated client reporting, goals, scorecards, forecasts, alerts, benchmarks, and AI-assisted analysis. It is less suitable when you require complex enterprise data modeling, unrestricted visual exploration, advanced statistical analysis, or highly specialized governance.
This Databox review 2026 examines the platform’s dashboards, reports, custom metrics, datasets, Genie AI Analyst, goals, forecasting, benchmarks, integrations, pricing, security, performance, user experience, and alternatives.
How We Evaluated Databox
The assessment follows the full reporting workflow, from connecting data and defining metrics to building dashboards, automating reports, monitoring goals, investigating performance changes, and distributing insights.
It draws on current Databox product documentation, plan information, security materials, integration coverage, and recurring themes from verified user feedback. Scores reflect practical product fit rather than a controlled performance benchmark.
Quick Assessment
Databox Review Summary
Databox is one of the most approachable analytics platforms for teams that need to consolidate business KPIs without implementing a complex BI stack. Its combination of native integrations, templates, custom metrics, dashboards, reports, goals, alerts, benchmarks, and AI makes it particularly useful for marketing teams, agencies, SaaS companies, sales leaders, consultants, and executives.
The platform is best understood as a performance-reporting system rather than a universal replacement for Power BI, Tableau, Looker, or a modern data warehouse. It helps you communicate and monitor trusted metrics efficiently, but it provides less modeling depth and analytical freedom than specialist BI platforms.
Databox at a Glance
| Category | Databox Assessment |
| Best For | Marketing, sales, agency, SaaS, and leadership teams centralizing KPI reporting |
| Overall Score | 8.8/10 |
| Ease of Use | 9.1/10 |
| Integrations | 9.2/10 |
| Dashboards and Reports | 9.0/10 |
| Performance Management | 8.9/10 |
| AI and Automated Insights | 8.6/10 |
| Data Preparation and Modeling | 7.8/10 |
| Starting Price | Free plan available; Analyst starts at $64 per month when billed annually |
| Main Strength | Fast, accessible reporting across many business applications |
| Main Limitation | Data-source pricing and less analytical depth than advanced BI platforms |
Recommendation: Databox is easy to recommend when your primary challenge is fragmented reporting rather than advanced data science. It can replace recurring spreadsheet reports, manual screenshots, disconnected marketing dashboards, and time-consuming presentation updates with a shared performance-management workflow.
Before purchasing, count every account, property, database, and advertising profile you plan to connect. Databox pricing is affected by data sources, and three Google Analytics properties or three advertising accounts generally count as three separate sources.
What Is Databox?
Analytics and Performance Management Overview
Databox is a cloud analytics platform for collecting, visualizing, analyzing, and distributing business performance data. It connects directly to supported SaaS applications, advertising platforms, CRMs, spreadsheets, databases, warehouses, and custom data sources.
Once connected, you can use pre-built or custom metrics to create dashboards, reports, scorecards, alerts, goals, forecasts, benchmarks, and AI-assisted analyses. Databox can also distribute data through secure links, email, Slack, television displays, embedded dashboards, and mobile applications.
Where Databox Fits in Your Data Stack
Databox usually sits above the systems where your operational data already lives. It does not require every smaller team to build a warehouse or dedicated ETL pipeline before creating useful reporting.
This direct-connection model shortens implementation time, but it also means your reporting depends on the definitions, permissions, history, and API limits of each connected platform. Databox can centralize metrics, but it cannot automatically correct inaccurate CRM stages, inconsistent campaign naming, duplicated transactions, or incomplete source data.
Who Should Use Databox?
- Marketing teams: Combine advertising, SEO, social, email, website, and CRM performance.
- Agencies and consultants: Automate branded client reporting across multiple accounts.
- Sales and revenue teams: Monitor pipeline, conversion rates, activity, revenue, and targets.
- SaaS companies: Track acquisition, subscriptions, retention, product, and financial KPIs.
- Executives: View high-level company scorecards without opening every operational platform.
Who May Prefer Another Analytics Platform?
You may prefer another product if you need advanced semantic modeling, extensive data transformation, statistical notebooks, sophisticated visual exploration, complex row-level security, large-scale embedded analytics, or a highly governed enterprise BI development process.
Databox is designed to make business reporting faster. It is not designed to reproduce every feature of a full data warehouse, ETL platform, planning suite, or enterprise BI environment.
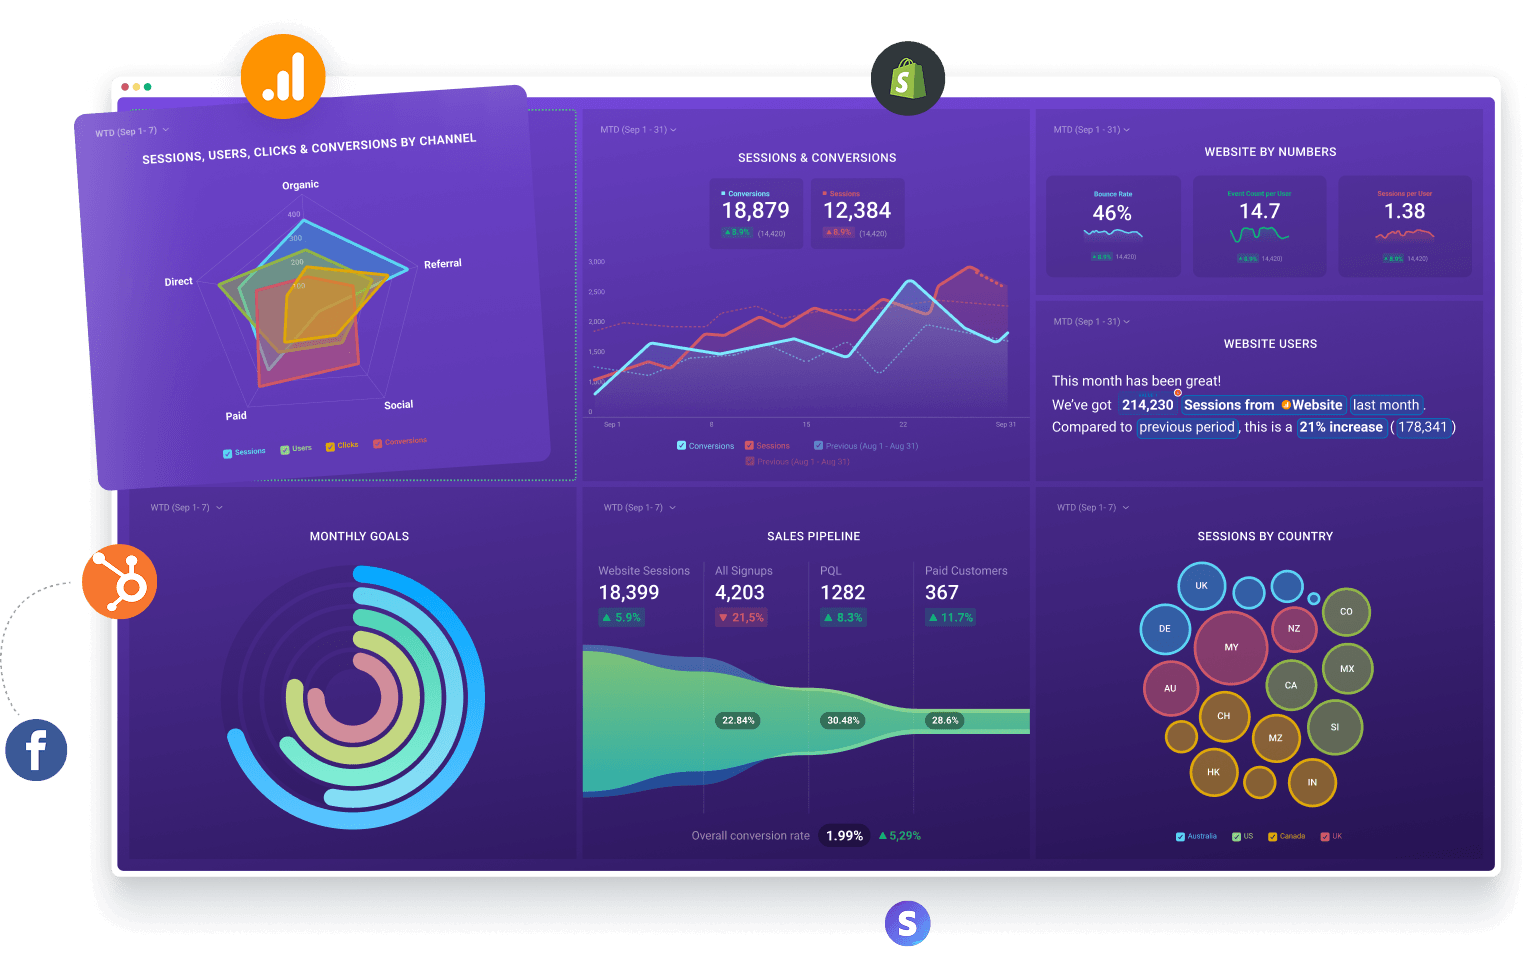
Key Features
Dashboards, Reports, Metrics, and Genie AI
Databox combines reporting and performance management more closely than many dashboard-only products. You can define metrics, visualize them, distribute updates, connect targets, detect anomalies, and investigate performance without moving between several separate applications.
Pre-Built and Custom Metrics
Databox provides ready-made metrics for supported integrations, helping you avoid manually recreating common calculations such as sessions, conversion rates, advertising spend, pipeline value, revenue, orders, and social engagement.
Custom metrics let you apply filters, segments, dimensions, calculations, and date comparisons. This gives you more control than simply importing the default overview from a connected application.
The critical implementation step is metric definition. Before building a dashboard, document the source, calculation, owner, update frequency, and business meaning of every important KPI. A visually attractive dashboard cannot resolve disagreement over what a qualified lead, active customer, or attributed conversion means.
No-Code Dashboards and Templates
Databox uses a drag-and-drop dashboard builder with KPI cards, charts, tables, progress visuals, funnels, comparisons, and other visualization types. Templates provide a useful starting point for common marketing, sales, ecommerce, agency, and executive reporting workflows.
Templates accelerate setup, but they should not determine your measurement strategy. Remove metrics that do not influence a decision, reorganize the dashboard around the questions your audience asks, and avoid turning every available data point into a separate visualization.
Automated Reports and Presentations
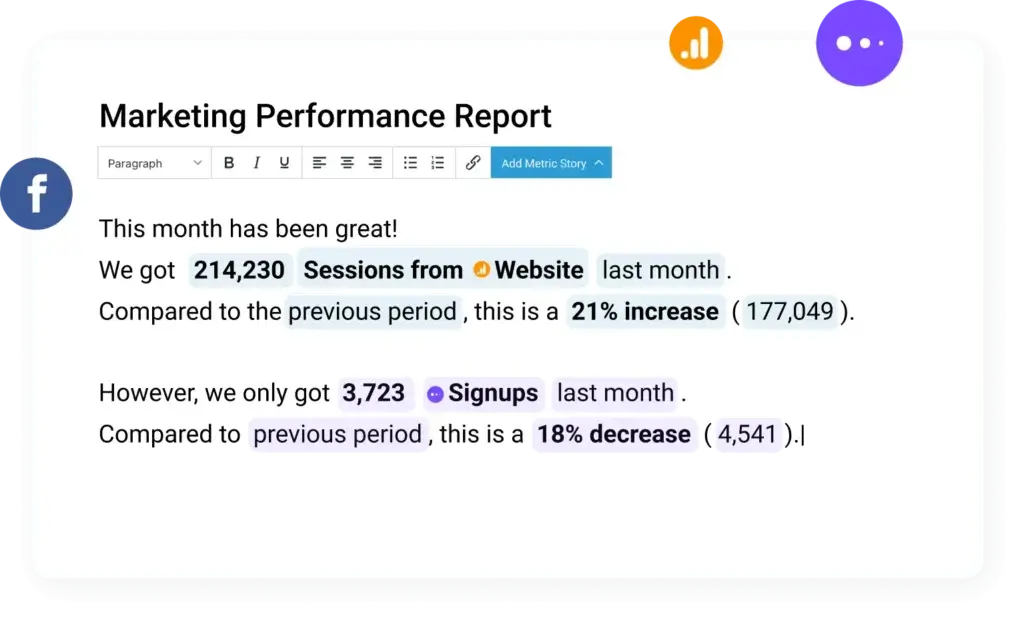
Reports convert live metrics into a structured stakeholder update. Databox supports flexible report layouts, presentation-style pages, speaker notes, scheduled delivery, PDF export, Slack sharing, and recurring distribution.
This is particularly valuable for agencies and department leaders. You can maintain one reporting structure and let connected metrics update automatically instead of rebuilding slides, copying screenshots, or exporting spreadsheets every month.
The layout system is designed for consistency and speed rather than unrestricted graphic design. Teams that expect the freedom of Canva, PowerPoint, or a custom design tool may find the reporting canvas more constrained.
Genie AI Analyst
Genie lets you ask questions about connected performance data in plain language. It can help create metrics, charts, dashboards, or datasets, summarize performance, identify anomalies, explain trends, and suggest areas for further investigation.
Genie is most valuable when the underlying data and metric definitions are reliable. AI can make analysis easier to access, but it cannot guarantee that a poorly configured source or ambiguous KPI becomes trustworthy.
AI usage is governed by monthly credits shared across the account. The Free plan includes 50 credits, Analyst includes 500, Pro includes 1,500, Growth includes 4,000, and Custom plans use a negotiated allowance. Teams planning frequent AI analysis should monitor credit consumption during the trial.
Goals, Scorecards, and Alerts
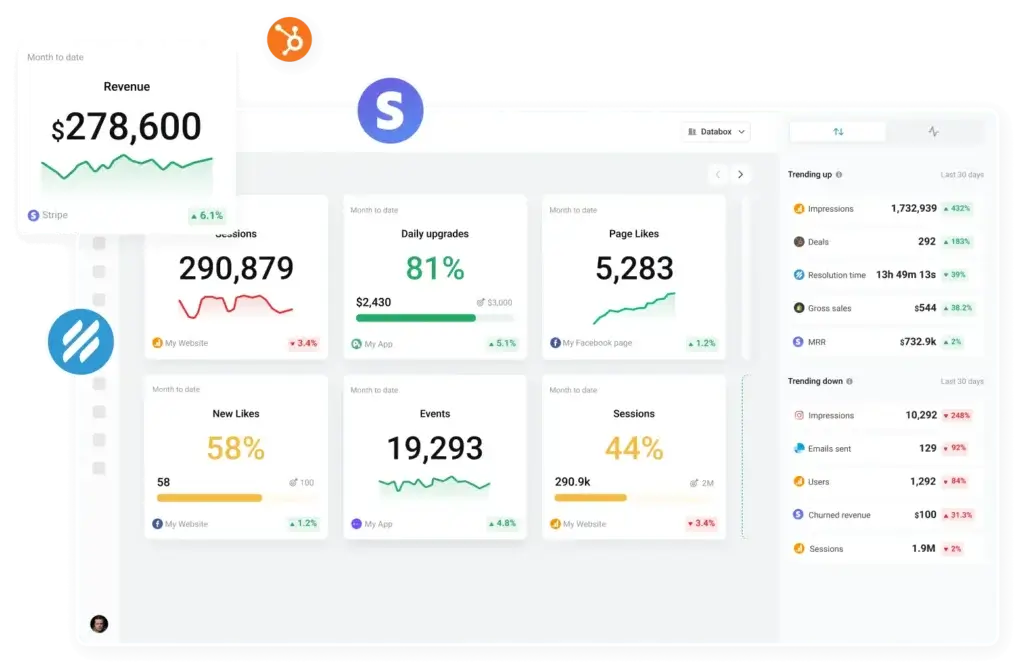
You can connect goals directly to Databox metrics, assign responsibility, monitor progress, and break longer targets into shorter measurement periods. Scorecards and alerts can be delivered through email, Slack, or mobile devices.
Goal-linked reporting changes the dashboard from a passive display into a management system. Instead of only seeing that revenue increased, you can see whether the result is sufficient, who owns the target, and where performance is falling behind.
Forecasting, Benchmarks, and OKRs
Growth and Custom plans include forecasting, allowing you to project future metric performance, evaluate scenarios, and convert projections into goals. Forecasting can extend into future months, quarters, or annual periods.
Benchmarks help you compare selected metrics with peer groups based on aggregated business data. They can provide context when your internal trend looks positive but still trails typical category performance.
OKRs connect higher-level objectives with measurable key results. They are included with Growth and Custom, while lower paid plans may require an add-on.
Datasets and Data Preparation
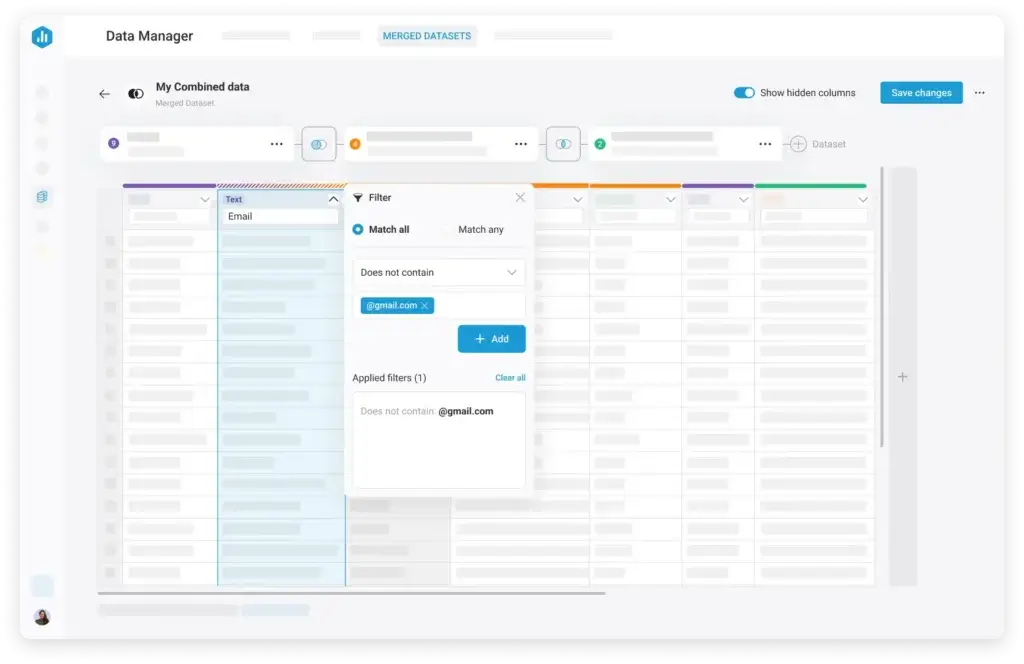
Datasets provide a more flexible analytical layer for cleaning, combining, filtering, and calculating raw data. You can merge records from multiple sources, create calculated columns, standardize fields, and build visualizations from the resulting table.
This extends Databox beyond simple connector-level dashboards, but it is still not equivalent to a complete ETL or analytics-engineering environment. Complex pipelines, version-controlled transformations, dependency management, testing, and warehouse optimization may still require specialist tools.
Dataset access also varies by plan. Analyst and Growth provide fuller preparation capabilities, while Pro limits dataset creation to certain source types and excludes some modification tools.
MCP, API, and AI Workflow Access
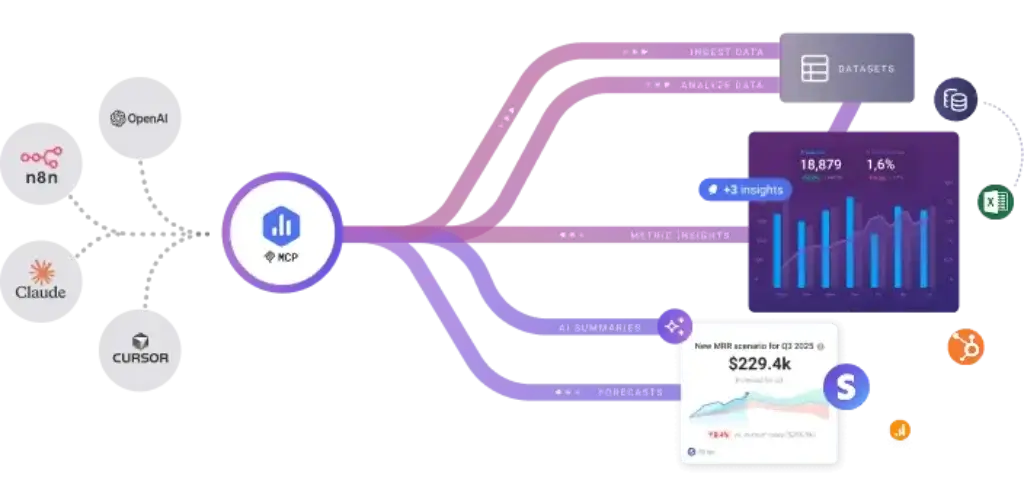
Databox provides an MCP server that can connect trusted metrics with compatible AI applications and workflow tools. Supported use cases include querying performance data from AI interfaces and triggering approved actions without repeatedly opening the Databox application.
The REST API supports custom data ingestion and integrations when a native connector is unavailable. This is useful for proprietary applications, internal systems, or industry-specific platforms, although custom integrations still require planning, authentication, monitoring, and ownership.
Databox Feature Overview
| Feature Area | What Databox Provides | Best For |
| Metrics | Pre-built metrics, calculations, filters, segments, and dimensions | Standardizing business KPIs |
| Dashboards | Drag-and-drop dashboards, templates, charts, tables, and KPI cards | Live performance monitoring |
| Reports | Automated reports, presentations, notes, PDFs, and scheduled delivery | Stakeholder and client reporting |
| AI | Genie questions, summaries, dashboard building, and anomaly analysis | Faster self-service analysis |
| Performance Management | Goals, alerts, scorecards, OKRs, forecasts, and benchmarks | Connecting data with targets |
| Data Preparation | Datasets, merged records, filters, and calculated columns | Multi-source analysis |
| Distribution | Email, Slack, secure links, TV, embeds, PDFs, and mobile apps | Recurring communication |
| Developer Access | REST API, custom integrations, and MCP connectivity | Custom data and AI workflows |
Pros and Cons
Databox Benefits and Limitations
Positive
✅ Fast multi-source reporting
✅ Accessible dashboard builder
✅ Strong report automation
✅ Goals and AI in one platform
Negative
❌ Data-source costs can grow
❌ Advanced modeling is limited
❌ Report design has constraints
❌ AI usage depends on credits
✅ Databox Pros
- Native integrations and templates shorten the route from disconnected data to usable reporting.
- Dashboards are approachable for non-technical managers, marketers, consultants, and clients.
- Reports, scorecards, alerts, and Slack delivery reduce repetitive manual reporting work.
- Goals, forecasts, benchmarks, and OKRs connect performance data with management decisions.
- Genie, MCP, datasets, and the API provide useful paths beyond basic dashboard consumption.
❌ Databox Cons
- Costs can increase quickly when you connect many advertising accounts, properties, clients, or locations.
- Free and Analyst plans support only one user, which limits collaboration at the lower price points.
- Advanced modeling, transformation, and visual exploration remain narrower than specialist BI platforms.
- Reports prioritize repeatability over unrestricted presentation design.
- Connection reliability, refresh speed, and metric availability can vary with third-party APIs.
Databox delivers the most value when you treat it as a focused performance system. Connecting every available source and displaying every metric usually creates more noise, more cost, and less accountability.
Getting Started
Setup, Metric Design, and User Adoption
Databox can be configured faster than many traditional analytics platforms, but a technically successful connection is not the same as a successful reporting program.
Account Setup and Data Connections
Start by connecting one operational area, such as marketing acquisition, sales pipeline, agency client reporting, or executive SaaS metrics. Authorize the required applications and verify that Databox can access the correct accounts, properties, workspaces, and historical periods.
Avoid connecting every account during the first session. Each connection affects plan requirements, and large implementations become difficult to validate when too many sources are introduced at once.
Building Your First Databox Dashboard
- Define the decisions the dashboard must support.
- Select five to ten primary KPIs instead of every available metric.
- Confirm each metric’s source, calculation, owner, and update frequency.
- Add targets and comparisons so current performance has context.
- Create drill-down or supporting views for diagnostic metrics.
- Test results against the original source applications.
- Assign a review cadence and action owner for each dashboard.
A good executive dashboard should answer whether performance is on track, what changed, why it may have changed, and who needs to respond. It should not require the reader to interpret dozens of unrelated charts.
Creating a Reusable Reporting System
Agencies and multi-team organizations should standardize a core reporting template while allowing controlled customization. Define which metrics are mandatory, which are client-specific, how commentary is added, and how often each report is delivered.
Template reuse saves time, but global template changes and multi-account administration should be tested carefully. Some reviewers specifically request easier ways to apply reporting changes across many client accounts.
Ease of Use by Role
Dashboard consumers can usually learn filtering, date selection, goals, and report navigation quickly. Marketers and operations managers can build useful reports without SQL when supported integrations expose the required metrics.
More advanced users need additional time for custom calculations, datasets, multi-source joins, APIs, permissions, forecasts, AI workflows, and source troubleshooting. Databox lowers the technical barrier, but it does not eliminate analytical judgment.
Performance and Reliability
Data Accuracy, Refresh Frequency, and Scale
Databox can centralize performance data from many applications, but the freshness and reliability of that data depend on both Databox and the connected provider.
Data Synchronization by Plan
The Free plan supports daily synchronization, while Analyst and Pro support hourly synchronization. Growth and Custom can refresh selected supported sources as frequently as every 15 minutes.
A 15-minute setting does not guarantee every integration will update at that frequency. Third-party API capabilities, authentication, rate limits, processing delays, and source-specific restrictions can affect availability.
Historical Data Limits
Free includes up to 11 months of historical data. Analyst and Pro provide up to 24 months. Growth and Custom include unlimited historical access according to the current plan comparison.
This matters for seasonal businesses, cohort comparisons, long sales cycles, and year-over-year analysis. Confirm the available history for every critical integration before assuming that older data will be imported automatically.
Testing Metric Accuracy
Validate totals, date zones, currencies, filters, attribution models, account permissions, and excluded records. A difference between Databox and a native platform may come from refresh timing or calculation logic rather than a broken connection.
Create a simple metric dictionary and record accepted tolerances. When stakeholders know how a metric is defined and when it refreshes, small timing differences are less likely to become a trust problem.
Practical Reliability Checklist
- Verify important metrics against source applications before publishing.
- Monitor connection errors, expired credentials, and API changes.
- Document time zones, currencies, filters, and attribution settings.
- Use alerts for genuine business exceptions rather than every fluctuation.
- Assign ownership for integrations, calculations, and dashboard changes.
Real-World Use Cases
Where Databox Delivers the Most Value
Marketing Performance Reporting
Databox can combine Google Analytics, advertising platforms, email marketing, social media, SEO tools, ecommerce systems, and CRM data. This lets you monitor acquisition, spend, traffic, conversions, leads, pipeline, and revenue without opening each application separately.
The strongest marketing dashboards connect channel activity with commercial outcomes. Avoid reporting only impressions, clicks, and sessions when the business ultimately needs qualified opportunities, customers, revenue, or retention.
Agency and Consultant Client Reporting
Agencies can standardize client dashboards, automate recurring reports, organize accounts through sub-accounts, and provide secure or white-labeled experiences. Growth is particularly relevant because it includes sub-accounts and a dedicated customer success manager.
The business case is strongest when Databox replaces many hours of screenshot collection, spreadsheet maintenance, slide preparation, and repetitive status explanation.
Sales and Revenue Operations
Sales leaders can combine CRM activity, pipeline, conversion, revenue, target, and marketing-source data. Goals and alerts help teams monitor whether activity is translating into sufficient pipeline and closed revenue.
Metric governance remains essential. Definitions for created pipeline, sourced revenue, influenced revenue, qualified opportunities, and forecast categories should be agreed before building the dashboard. This guide to CRM sales forecasting can help structure the reporting model.
SaaS Executive Scorecards
SaaS companies can combine subscription billing, CRM, acquisition, website, finance, and product-related data. Common metrics include recurring revenue, new subscriptions, expansion, churn, customer acquisition cost, pipeline, activation, and support performance.
Databox is effective for executive monitoring, but detailed cohort analysis, event-level product analytics, and financial modeling may still belong in specialist platforms.
Multi-Location and Operational Reporting
Businesses with several branches, stores, franchises, or business units can create repeated views around sales, leads, advertising, service, or operational performance. Source-based pricing should be modeled carefully because each property or location account can increase the connection count.
What Users Say About Databox
Verified reviewers frequently praise the accessible dashboards, centralized reporting, simple integrations, custom metrics, client-facing presentation, and responsive support.
Recurring criticisms include missing niche connectors, occasional lag or integration issues, limitations in report design, a learning curve for custom metrics, and costs that become more noticeable as source requirements expand.
Pricing
How Much Does Databox Cost?
Databox provides individual and team plans. The lower tiers are useful for a single analyst or small proof of concept, while Pro and above are designed for wider collaboration.
Databox Pricing Plans
| Plan | Current Annual-Billing Price | Best For |
| Free | $0 per month | Testing one dashboard or a small personal KPI workflow |
| Analyst | $64 per month | One analyst using up to five sources and unlimited reports |
| Pro | $159 per month | Teams needing unlimited users and standard reporting |
| Growth | $399 per month | Agencies and growing companies needing forecasts, sub-accounts, and faster sync |
| Custom | Tailored pricing | Organizations needing SSO, advanced security, setup assistance, and flexible AI |
Prices shown are public US references for annual billing and may vary by currency, tax, contract, region, or future product changes. Databox also advertises a 14-day Growth trial without requiring a credit card.
Free Plan
Free supports one user, three fixed data sources, 50 monthly AI credits, one dashboard or report, ten custom metrics, 11 months of history, and daily synchronization.
It is useful for evaluating the interface or maintaining one small scorecard, but the dashboard, history, user, and source limits make it unsuitable for a full reporting program.
Analyst Plan
Analyst costs $64 per month when billed annually. It includes one user, five fixed sources, 500 AI credits, all integrations, unlimited dashboards, unlimited reports, unlimited custom metrics, datasets, hourly synchronization, and 24 months of historical data.
This is a strong option for an individual reporting specialist, freelancer, or analyst. It becomes restrictive when several people need direct access because the plan remains limited to one user.
Pro Plan
Pro costs $159 per month when billed annually. It includes three data sources, unlimited users, 1,500 AI credits, unlimited dashboards, reports, and custom metrics, hourly synchronization, and 24 months of history.
Additional data sources cost $5.60 per source per month under annual billing. Pro is the practical collaboration entry point, but its included source allowance is lower than Analyst, and dataset modification capabilities are limited.
Growth Plan
Growth costs $399 per month when billed annually. It includes three sources, unlimited users, 4,000 AI credits, full datasets, unlimited historical data, forecasting, OKRs, fiscal-calendar support, sub-accounts, and a dedicated customer success manager.
Up to five supported sources can use 15-minute synchronization. Additional data sources currently cost $5.60 per source per month under annual billing.
Custom Plan
Custom pricing includes flexible source and AI arrangements, white-labeling, advanced security, single sign-on, account setup, priority support, and a security and compliance review.
This tier is designed for enterprises, large agencies, embedded client-reporting programs, and organizations with stronger identity or governance requirements.
Understanding Databox Data-Source Pricing
Do not estimate cost by counting integration brands. A data source is generally an individual account or property. Connecting Google Analytics for three websites, Facebook Ads for five clients, and HubSpot for two business units may already represent ten sources.
Create an inventory before selecting a plan. Include current sources, planned clients, additional locations, staging properties, duplicate accounts, and anticipated expansion over the contract period.
Hidden Costs and Overall Value
Total cost may include extra data sources, AI credits, white-labeling, advanced security, priority support, 15-minute synchronization, implementation, custom API work, and internal metric governance.
Databox can still produce a strong return when it replaces recurring manual reporting. Compare the subscription with the staff hours spent collecting data, repairing spreadsheets, preparing presentations, and explaining inconsistent metrics.
Integrations
Applications, Databases, Spreadsheets, and APIs
Databox supports more than 130 integrations across marketing, advertising, CRM, ecommerce, finance, databases, spreadsheets, and automation tools.
Marketing and Advertising Integrations
Common integrations include Google Analytics 4, Google Ads, Facebook Ads, Facebook Pages, LinkedIn Ads, HubSpot Marketing, and other acquisition or engagement platforms.
These connectors make Databox especially attractive for marketing teams, but metric availability can differ by integration. Confirm that the specific dimensions, attribution settings, campaign fields, and historical data you require are supported.
CRM, Sales, Ecommerce, and Finance
Supported business applications include HubSpot CRM, Salesforce, Pipedrive, Shopify, Stripe, QuickBooks, and other sales or revenue systems.
Cross-functional reporting becomes more valuable when the dashboard connects marketing activity to opportunities, orders, subscriptions, or revenue. This also creates more governance work because the systems may define customers, dates, currencies, and ownership differently.
Databases, Warehouses, and Spreadsheets
Databox can connect with Google BigQuery, MySQL, PostgreSQL, Snowflake, Microsoft Azure, Google Cloud, Google Sheets, and Excel.
Database and spreadsheet connections provide flexibility when a native SaaS connector does not contain the required business logic. They can also expose data-quality problems that were previously hidden inside manual reports.
Zapier, Make, Dataddo, and Custom APIs
Automation and integration platforms can connect additional workflows, while the Databox API supports custom metric ingestion. Custom integrations are useful, but they should have documented authentication, error handling, monitoring, and maintenance ownership.
Security, Compliance, and Governance
Protecting Business Reporting Data
Databox states that its security program includes SOC 2 certification and support for GDPR and CCPA-related privacy requirements. Data is encrypted with AES-256 at rest and TLS 1.2 or higher in transit.
The platform is hosted on Amazon Web Services infrastructure in the United States. Databox also provides two-factor authentication, access roles, data-processing documentation, and customer data ownership commitments.
Advanced Security Features
Single sign-on, audit logs, session controls, login records, and enforced account-level security are included in the Custom plan or available as advanced-security options on selected lower plans.
This distinction matters for regulated organizations. Do not assume that every security feature described in the Trust Center is included in the plan you purchase.
Practical Governance Requirements
- Assign owners for integrations, custom metrics, dashboards, and reports.
- Apply least-privilege access and review users regularly.
- Document how confidential financial or customer data is represented.
- Review subprocessors, retention, deletion, and regional requirements.
- Request current compliance reports before approving regulated use.
Security controls protect access, while reporting governance protects meaning. Your organization still needs a process for approving metrics, correcting errors, retiring outdated dashboards, and communicating definition changes.
Comparison
Databox Alternatives
The best Databox alternative depends on whether you prioritize agency workflows, free Google reporting, advanced business intelligence, or a broader data and application platform.
Databox Alternatives Compared
| Platform | Main Strength | Best Fit |
| Databox | Accessible KPI reporting and performance management | Marketing, sales, SaaS, and executive teams |
| AgencyAnalytics | Agency-first client reporting and campaign management | SEO and digital marketing agencies |
| Looker Studio | Free and flexible Google-centered dashboards | Budget-conscious marketing reporting |
| Power BI | Advanced modeling and Microsoft integration | Governed organizational analytics |
| Domo | Integrated data, analytics, applications, and workflows | Larger cross-functional deployments |
Databox vs AgencyAnalytics
AgencyAnalytics is designed specifically for marketing agencies. It combines client dashboards with SEO, advertising, call tracking, reporting, and agency-management workflows.
Databox is usually more flexible for company-wide KPI reporting, SaaS metrics, executive scorecards, goals, forecasts, and cross-functional analysis. AgencyAnalytics may be preferable when rank tracking, client portals, and agency-specific workflows are the leading requirements.
Databox vs Looker Studio
Looker Studio provides an accessible route to free dashboards, particularly for Google Analytics, Google Ads, BigQuery, and spreadsheet data.
Databox offers a more structured performance-management experience with automated reports, scorecards, goals, alerts, benchmarks, forecasts, mobile access, and broader guided templates. Looker Studio can be less expensive, but connector costs and dashboard maintenance may increase as reporting becomes more complex.
Databox vs Power BI
Microsoft Power BI provides deeper data preparation, semantic modeling, DAX calculations, governance, visualization, and Microsoft ecosystem integration.
Databox is faster and more approachable for SaaS-connected KPI reporting. Power BI is the stronger choice when your organization needs reusable enterprise models, complex calculations, controlled workspaces, and detailed analytical exploration. Read our Power BI review for a complete comparison of its strengths and licensing.
Databox vs Domo
Domo combines data integration, transformation, dashboards, AI, workflow automation, low-code applications, and embedded analytics.
Databox is simpler to adopt for recurring KPI reporting and performance management. Domo is better suited to larger organizations that want analytics to support operational applications and automated workflows across many departments. See our complete Domo review.
Final Assessment
Is Databox Worth It?
Databox is worth considering when your team has useful performance data scattered across SaaS applications but lacks a consistent way to monitor, explain, and distribute it.
Its strongest combination is native integrations, pre-built metrics, custom calculations, dashboards, reports, goals, alerts, forecasts, benchmarks, datasets, Genie AI, and automated distribution. Together, these capabilities can turn recurring reporting from a manual production task into an ongoing management process.
The platform is particularly effective for marketing teams, agencies, sales leaders, consultants, SaaS businesses, and executives. These users often need accessible answers and repeatable reporting more urgently than they need advanced data modeling.
The main concern is scaling cost and complexity. Data-source charges can accumulate across clients, properties, advertising accounts, and locations. Free and Analyst support only one user, while important features such as forecasting, full sub-account management, white-labeling, and advanced security require higher plans or add-ons.
Choose Databox when speed, usability, automated KPI reporting, and performance management are your main priorities. Consider AgencyAnalytics for agency-specific workflows, Looker Studio for lower-cost Google reporting, Power BI for deeper modeling, or Domo for broader enterprise data applications.
Frequently Asked Questions
Have More Questions?
What is Databox?
Databox is a cloud analytics and performance-management platform for connecting business data, creating dashboards and reports, monitoring goals, and distributing insights.
Is Databox a business intelligence tool?
Yes. Databox provides integrations, metrics, dashboards, reports, datasets, AI analysis, forecasts, and performance management. It is more accessible but less technically deep than many enterprise BI platforms.
Is Databox free?
Yes. Databox offers a Free plan with one user, three data sources, one dashboard or report, ten custom metrics, 50 AI credits, and daily data synchronization.
How much does Databox cost?
Databox offers Free, Analyst, Pro, Growth, and Custom plans. Annual-billing prices currently start at $64 per month for Analyst, $159 for Pro, and $399 for Growth.
How many integrations does Databox support?
Databox supports more than 130 integrations covering marketing, advertising, CRM, ecommerce, finance, databases, warehouses, spreadsheets, and automation tools.
What is Databox Genie?
Genie is Databox’s AI Analyst. It can answer performance questions, summarize results, identify anomalies, explain trends, and help build metrics, dashboards, charts, or datasets.
Is Databox good for agencies?
Yes. Databox is strong for automated client dashboards and reports. Growth adds sub-accounts, forecasting, faster synchronization, OKRs, and a dedicated customer success manager.
Can Databox combine data from multiple sources?
Yes. Databox can display metrics from several integrations and use datasets to merge, filter, standardize, and calculate data from multiple supported sources.
What are the best Databox alternatives?
Leading alternatives include AgencyAnalytics for agencies, Looker Studio for low-cost Google reporting, Power BI for advanced modeling, and Domo for broader data applications.
Is Databox worth it?
Databox is worth it for teams that want accessible KPI dashboards, automated reports, goals, alerts, forecasts, and AI analysis without implementing a complex enterprise BI stack.