Introduction: Why Mastering Gantt Charts Matters
If you’ve ever struggled to keep a project on track, you’re not alone. Managing multiple tasks, deadlines, and dependencies can feel overwhelming, especially when working with a team. That’s where Gantt charts come in.
Originally developed by Henry Gantt in the early 1900s, these charts have become one of the most powerful project management tools. Whether you’re leading a software development project, a marketing campaign, or a construction plan, a Gantt chart helps you visualize timelines, track progress, and ensure everything runs smoothly.
In this guide, you’ll learn:
- What a Gantt chart is and how it works
- Why it’s a game-changer for project management
- How to create one and avoid common pitfalls
By the end, you’ll have all the knowledge you need to master Gantt charts and manage projects like a pro.
What is a Gantt Chart?
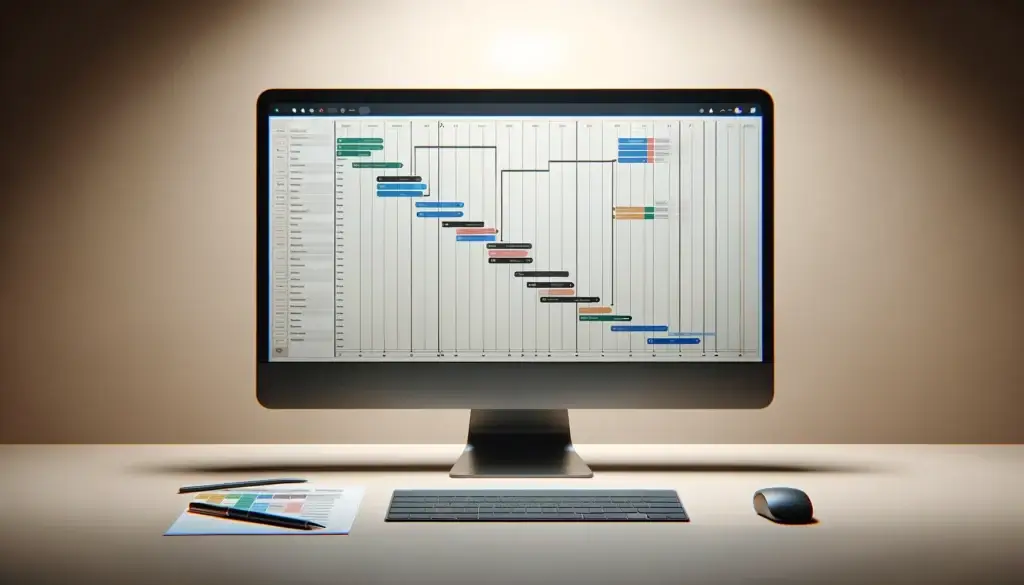
At its core, a Gantt chart is a visual representation of your project’s timeline. It breaks down tasks, assigns deadlines, and shows how different tasks depend on each other, all in a simple bar chart format.
Key Components of a Gantt Chart
A typical Gantt chart includes:
✅ Tasks – The specific activities needed to complete the project.
✅ Timelines – Start and end dates for each task.
✅ Dependencies – How tasks are linked (e.g., one task must finish before another can start).
✅ Milestones – Major checkpoints that mark important progress.
✅ Resources – Who is responsible for each task.
Think of a Gantt chart like a roadmap, it helps you and your team stay on course, avoid delays, and adjust when things don’t go as planned.
🔹 How is a Gantt Chart Different from a To-Do List?
Unlike a simple task list, a Gantt chart gives you a clear, bird’s-eye view of your entire project. It’s not just about what needs to be done, it also shows when and how tasks are interconnected.
Why Use a Gantt Chart? Key Benefits Explained
So why should you bother using a Gantt chart instead of a spreadsheet or a whiteboard? Here are the top reasons why project managers swear by it:
🚀 1. Clear Project Roadmap
Gantt charts eliminate confusion by laying out tasks in chronological order. You always know what’s happening next, making it easier to prioritize work and hit deadlines.
⏳ 2. Improved Time Management
Ever had a project run late because of poor scheduling? A Gantt chart helps you set realistic deadlines and adjust if things go off track. You can see at a glance which tasks are on time, delayed, or at risk.
🤝 3. Better Team Collaboration
When team members understand who’s responsible for what, accountability improves. Gantt charts help avoid bottlenecks by ensuring tasks don’t overlap or conflict.
🔄 4. Helps Manage Task Dependencies
Some tasks can’t start until others finish. A Gantt chart clearly maps out dependencies, so you don’t accidentally schedule work that can’t begin yet.
📊 5. Real-Time Project Tracking
With modern Gantt chart tools (like ClickUp, monday.com, or MS Project), you can track progress in real-time, making it easy to identify delays and take corrective action before they become major issues.
Mastering Gantt Chart Components
Before you create a Gantt chart, you need to understand its building blocks. Each component plays a crucial role in organizing and visualizing your project.
📌 1. Task Bars: The Backbone of a Gantt Chart
Every task in your project is represented as a horizontal bar on the timeline. The length of the bar shows how long the task will take, and its position determines when it starts and ends.
🔗 2. Dependencies: How Tasks Connect
Most projects involve tasks that rely on each other. Gantt charts allow you to define dependencies, ensuring that you don’t schedule work out of order.
The four main types of dependencies are:
- Finish-to-Start (FS) – Task A must finish before Task B starts (most common).
- Start-to-Start (SS) – Task B can start only when Task A begins.
- Finish-to-Finish (FF) – Task B can finish only when Task A is completed.
- Start-to-Finish (SF) – Task A must start before Task B can finish (least common).
⭐ 3. Milestones: Major Checkpoints
Milestones mark significant events in your project, like a product launch, approval deadline, or key deliverable. They help keep your team focused on critical progress points.
🔥 4. Critical Path: The Fastest Route to Completion
The Critical Path is the sequence of tasks that determines your project’s shortest possible duration. If any task on the critical path is delayed, your entire project timeline is affected.
🔄 5. Task Owners: Who’s Responsible for What?
Assigning task owners ensures accountability. A well-structured Gantt chart clearly shows who is working on each task, so nothing gets overlooked.
Mastering these components will help you build a Gantt chart that is clear, functional, and effective.
Step-by-Step Guide: How to Create a Gantt Chart
Creating a Gantt chart doesn’t require advanced project management skills, you just need the right steps and the right tool. Here’s how to do it:
Step 1: Define Your Project Goals
Before jumping into a Gantt chart, be clear on what you’re trying to achieve. Ask yourself:
✅ What is the end goal of this project?
✅ What key deliverables need to be completed?
✅ Who is involved, and what are their responsibilities?
Step 2: List Out All Tasks
Break your project into smaller, manageable tasks. Each task should be actionable and specific (e.g., instead of “Develop Website,” break it down into “Design Homepage,” “Code Backend,” “Test Functionality”).
Step 3: Organize Tasks by Phases
Structure your tasks in logical phases (e.g., Research → Planning → Execution → Review). This makes your Gantt chart easier to navigate and helps with progress tracking.
Step 4: Set Start and End Dates
Estimate how long each task will take and assign realistic deadlines. Be mindful of potential roadblocks, like resource availability or external dependencies.
Step 5: Add Task Dependencies
Identify which tasks depend on others. For example, “Create Design Mockups” must be completed before “Develop UI” begins. Most Gantt chart tools let you link tasks visually.
Step 6: Assign Responsibilities
Make sure every task has an owner so there’s clear accountability. Without assigned roles, tasks can slip through the cracks.
Step 7: Choose a Gantt Chart Tool
You can build Gantt charts using Excel, Google Sheets, or project management software like:
- ClickUp – Best for team collaboration
- monday.com – User-friendly interface
- Microsoft Project – Enterprise-level features
- Smartsheet – Great for automation
Step 8: Monitor and Adjust
Your Gantt chart isn’t set in stone. Update it as tasks progress, deadlines shift, or priorities change. A well-maintained Gantt chart keeps your team aligned and productive.
Pro Tips for Effective Gantt Chart Management
Even the best Gantt charts can fail if not used correctly. Here are pro-level tips to get the most out of your chart:
❌ 1. Avoid Overloading Your Gantt Chart
Don’t cram every minor detail into your chart, it should provide clarity, not confusion. Stick to high-level tasks and milestones, and use sub-tasks or notes for deeper details.
🎯 2. Focus on the Critical Path
Keep an eye on the critical path, as any delay here can push your entire project back. Prioritize these tasks to avoid bottlenecks.
🔄 3. Build Flexibility Into Your Schedule
Unexpected delays happen. Add buffer time between key tasks to account for changes and reduce last-minute stress.
📊 4. Use Color Coding for Clarity
Many Gantt chart tools allow you to color-code tasks. For example:
- Red = Critical tasks
- Blue = In-progress tasks
- Green = Completed tasks
A well-structured, visually clear Gantt chart makes tracking progress much easier.
🚀 5. Keep Your Team Involved
A Gantt chart shouldn’t be a solo tool, keep your team updated. Schedule regular check-ins and encourage team members to update task progress.
Master these best practices, and your Gantt charts will become a powerful tool for streamlining projects with confidence and ease.
Best Gantt Chart Software for 2025
Not all Gantt chart tools are created equal. Some are designed for small teams, while others offer enterprise-level project tracking. To save you time, we’ve narrowed it down to four of the best Gantt chart software for 2025:
monday.com
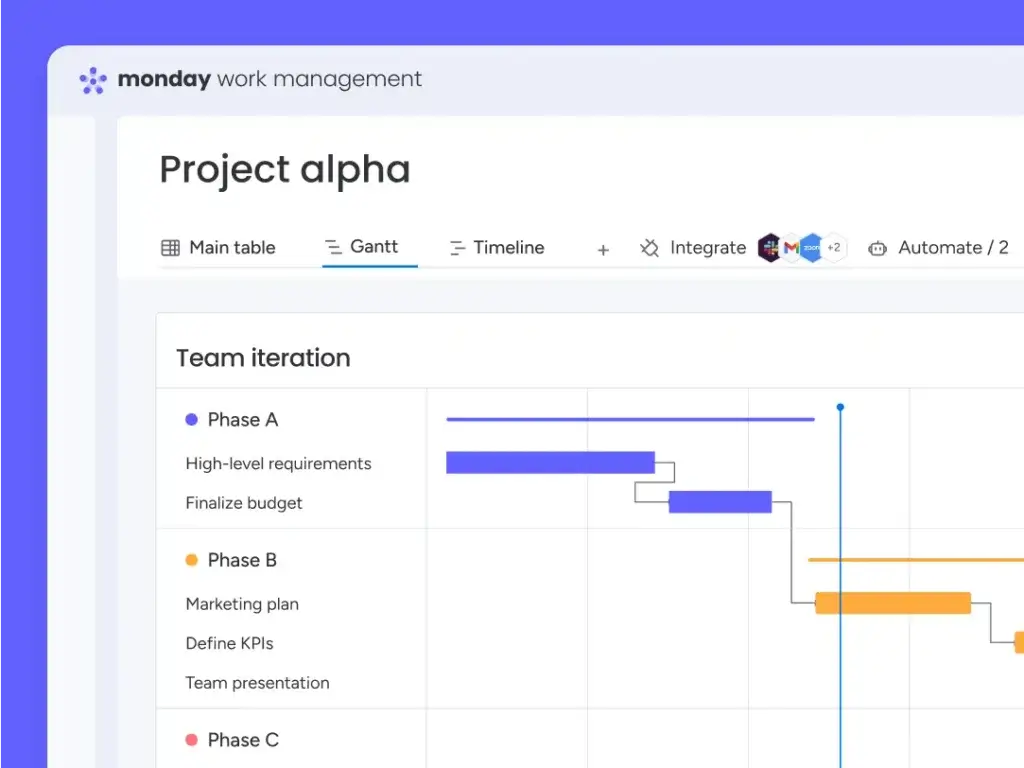
Why choose it? If you want an intuitive, drag-and-drop interface, monday.com is a great choice. Its Gantt chart view lets you easily adjust deadlines, dependencies, and milestones, perfect for teams that need a simple yet powerful tool.
✅ Key Features:
- Interactive Gantt chart view with color-coded progress tracking
- Automation to notify teams of timeline shifts
- Easy task assignments with customizable workflows
- Integrates with Slack, Google Drive, and Microsoft Teams
Best for: Marketing teams, creative projects, and small-to-medium businesses that need visual project tracking without a steep learning curve.
ClickUp
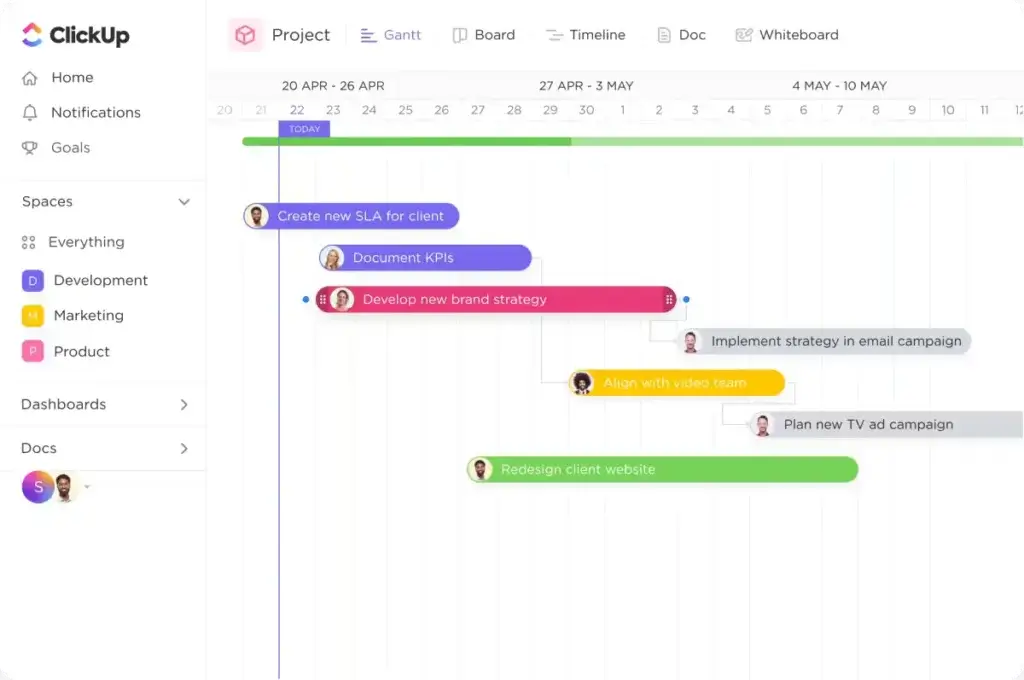
Why choose it? ClickUp stands out because of its highly customizable Gantt chart view. If you’re managing complex projects with multiple moving parts, ClickUp gives you full control over how tasks, dependencies, and timelines are displayed.
✅ Key Features:
- Drag-and-drop Gantt chart for real-time project adjustments
- Critical path tracking to highlight important tasks
- Task dependencies with automatic updates when schedules change
- Unlimited projects with free-tier access
Best for: Teams that need advanced Gantt chart features, especially in software development, marketing, and product management.
Miro
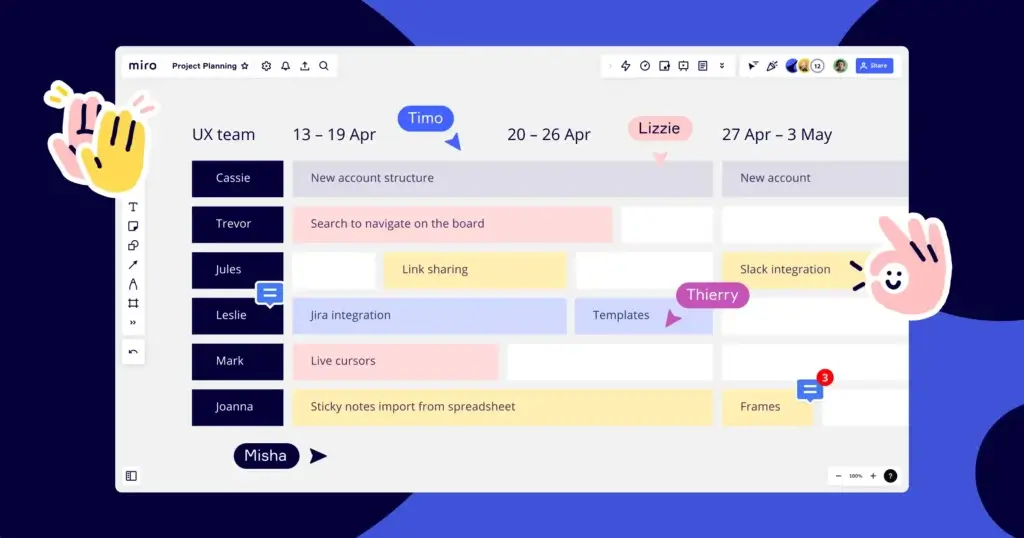
Why choose it? Unlike traditional Gantt chart tools, Miro combines whiteboarding with project planning, making it ideal for brainstorming and strategic planning alongside structured timelines.
✅ Key Features:
- Drag-and-drop Gantt templates with real-time team collaboration
- Sticky notes & mind maps to brainstorm tasks before structuring a timeline
- Integrations with Asana, Trello, and Jira for seamless project management
- Collaboration-friendly with comments, mentions, and live editing
Best for: Remote teams, designers, and agile teams who want a mix of brainstorming and structured project planning.
Smartsheet
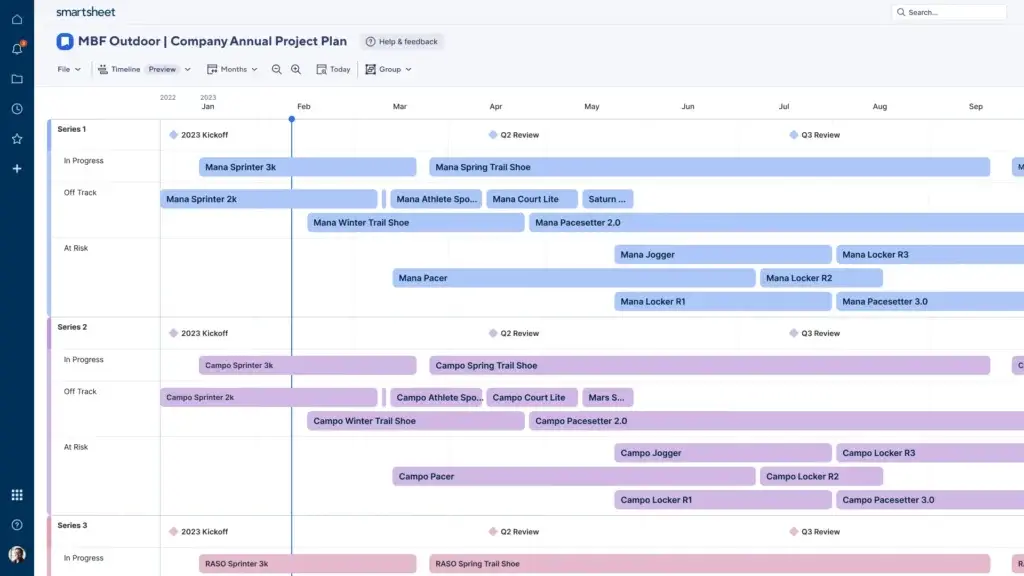
Why choose it? Smartsheet is a powerhouse for large organizations that need detailed reporting, automation, and robust Gantt charts. If you’re managing large-scale projects or multiple teams, Smartsheet offers the structure and control you need.
✅ Key Features:
- Excel-style interface with advanced Gantt chart views
- Task automation to trigger updates and approvals
- Resource management to track team workloads
- Enterprise-grade security and compliance controls
Best for: Large organizations, enterprises, and teams handling complex, long-term projects that require detailed tracking and automation.
Which One is Right for You?
| Tool | Best For | Strength |
| Monday.com | Simple, visual project tracking | User-friendly, color-coded Gantt charts |
| ClickUp | Advanced customization | Critical path & dependency tracking |
| Miro | Collaborative planning | Brainstorming + structured timelines |
| Smartsheet | Enterprise project management | Automation & advanced reporting |
Conclusion: Take Your Project Management to the Next Level
By now, you’ve gained a solid understanding of Gantt charts, what they are, why they’re useful, and how to create and manage them effectively. Whether you’re leading a small team or handling large-scale projects, a well-structured Gantt chart can be the key to keeping everything on track.
Key Takeaways:
✅ Gantt charts provide a clear visual roadmap for your project timelines, tasks, and dependencies.
✅ They help prevent scheduling conflicts and improve collaboration by assigning responsibilities.
✅ Tools like monday.com, ClickUp, Miro, and Smartsheet offer different levels of functionality depending on your needs.
✅ Following best practices, like focusing on the critical path, keeping schedules flexible, and involving your team, ensures your Gantt charts stay effective.
What’s Next? Start Using Gantt Charts Today
Don’t just read about Gantt charts, put them into action! Here’s what you can do right now:
1️⃣ Choose a Gantt chart tool that fits your needs (monday.com for simplicity, ClickUp for customization, Miro for collaboration, or Smartsheet for enterprise-level management).
2️⃣ Start with a small project, map out tasks, set deadlines, and define dependencies.
3️⃣ Share it with your team and track progress in real time.
4️⃣ Refine and improve as you go, no project plan is perfect from day one!
With the right approach, Gantt charts can transform the way you manage projects, helping you stay on top of deadlines, resources, and team collaboration with ease.
🚀 Now it’s your turn! Which tool will you try first?
FAQs
1. What’s the best way to create a Gantt chart for free?
If you’re looking for a free way to create Gantt charts, ClickUp and Miro offer free plans with basic Gantt chart functionality. You can also use Google Sheets or Excel to manually create a Gantt chart by formatting a bar chart with task timelines.
2. What are the most common mistakes when using a Gantt chart?
Many beginners overcomplicate their Gantt charts by adding too many small tasks, ignoring dependencies, or failing to update progress regularly. A good Gantt chart should be clear, flexible, and focus on key milestones rather than micromanaging every step.
3. When should I use a Gantt chart instead of a Kanban board?
Use a Gantt chart when you need to track time-sensitive projects with deadlines and dependencies. On the other hand, a Kanban board (like Trello or Jira) is better for ongoing workflows and agile task management without strict timelines.
4. How do I handle delays in a Gantt chart?
When a task is delayed, update your Gantt chart by adjusting dependencies and rebalancing workloads. Tools like monday.com and Smartsheet allow you to automatically shift timelines when one task falls behind, preventing cascading delays.
5. Can Gantt charts be used for Agile project management?
Yes, but they’re not always the best fit. Agile teams often prefer Kanban or Scrum boards because they focus on flexible task prioritization rather than strict timelines. However, you can use a Gantt chart in Agile for high-level planning and sprint roadmaps.
6. What industries benefit the most from Gantt charts?
Gantt charts are widely used in construction, software development, marketing, event planning, and product management, anywhere tasks need to be completed in a structured, sequential order.
7. How often should I update my Gantt chart?
It depends on your project’s complexity. For fast-moving projects, update your Gantt chart daily or weekly to reflect progress. For long-term projects, bi-weekly or monthly updates may be enough. Automated Gantt charts in ClickUp or monday.com make updates easier.
8. Can I use Gantt charts for personal productivity?
Absolutely! A personal Gantt chart can help you plan major goals like launching a blog, writing a book, or preparing for an exam. Simple tools like Miro or Excel work well for personal projects.
9. Can these charts be used for small projects, or are they only suitable for large-scale endeavors?
They are versatile and can be effectively used for projects of any size, from small to large-scale. Their adaptability makes them suitable for a wide range of projects.
10. What are the limitations of using these charts?
While highly effective for schedule visualization, they may not be as useful for capturing more nuanced aspects of project management, such as in-depth task details or rapidly changing priorities.