Introduction
ITSM metrics and KPIs help you understand whether your IT service management strategy is actually improving service quality, reducing disruptions, and supporting business goals.
Without the right measurements, your team may feel busy, but you may not know whether service delivery is becoming faster, more reliable, or more cost-efficient. The right ITSM metrics give you a clear view of performance across incidents, requests, changes, service levels, user satisfaction, and cost.
That matters because ITSM is not only about closing tickets. It is about helping people work with fewer interruptions, giving IT leaders better visibility, and creating a repeatable way to improve service delivery over time.
By tracking the right ITSM KPIs, you can:
- Identify service bottlenecks: See where tickets, approvals, or escalations slow down.
- Improve incident resolution: Track how quickly your team responds and restores service.
- Measure user experience: Understand how employees or customers feel after support interactions.
- Control service desk costs: Connect ticket volume, staffing, automation, and cost per ticket.
- Support continual improvement: Use data to guide better processes, tools, and decisions.
This guide explains the most important ITSM metrics and KPIs to track in 2026, how to calculate them, how to choose the right KPIs for your business, and which ITSM tools can help you measure performance more effectively.
What Are ITSM Metrics and KPIs?
ITSM metrics are measurable data points that show how your IT services are performing. They can include ticket volume, response time, resolution time, SLA compliance, reopen rate, self-service usage, customer satisfaction, and cost per ticket.
ITSM KPIs are the most important metrics tied to your business goals. In other words, every KPI is a metric, but not every metric should be treated as a KPI.
For example, the number of tickets closed is a metric. But if your goal is to improve service quality, your real KPI may be first contact resolution, SLA compliance, or CSAT after ticket closure.
The key is to avoid measuring everything just because your ITSM tool can report it. Instead, you should focus on the metrics that help you answer practical questions:
- Are incidents being resolved fast enough?
- Are users satisfied with IT support?
- Are changes being implemented without disruption?
- Are tickets being reopened because issues were not fully fixed?
- Is self-service reducing repetitive support requests?
- Is the service desk becoming more efficient without lowering quality?
When you connect metrics to clear objectives, your ITSM reporting becomes much more useful. It moves from passive reporting to active service improvement.
Key ITSM Metrics and KPIs to Track in 2026
The best ITSM KPI set should include a balance of operational efficiency, service quality, user experience, and financial performance. Below are the most important metrics to track, along with formulas and improvement tips.
1. Mean Time to Acknowledge (MTTA)
Definition: Mean Time to Acknowledge measures the average time between when a ticket, incident, or alert is created and when your team acknowledges it.
Why it matters: MTTA shows how quickly your support team reacts. A low MTTA means users are not left waiting without confirmation, and urgent incidents can be reviewed before they escalate.
This metric is especially important for high-priority incidents, security-related alerts, VIP support, and business-critical systems.
Formula:
MTTA = Total time to acknowledge tickets / Number of acknowledged tickets
How to improve MTTA:
- Use automated ticket routing based on category, priority, or department.
- Set priority-based alerts for critical incidents.
- Create clear ownership rules for incoming tickets.
- Use AI-assisted triage to summarize and classify new requests faster.
2. Mean Time to Resolve (MTTR)
Definition: Mean Time to Resolve measures the average time it takes to fully resolve an incident after it is reported.
Why it matters: MTTR is one of the most important ITSM performance metrics because it shows how long users are affected by an issue. MetricNet defines MTTR as the average elapsed time from when an incident is opened until it is closed, and notes that it is commonly measured in business hours rather than clock hours.
Quick resolution times help reduce operational disruption, restore productivity, and improve confidence in IT support. MetricNet also identifies MTTR as a key driver of customer satisfaction in desktop support because users may be blocked or forced to use workarounds until the incident is resolved.
MetricNet’s MTTR guidance is a useful source if you want to explain why resolution time is more than an internal service desk metric.
Formula:
MTTR = Total resolution time / Number of resolved incidents
How to improve MTTR:
- Improve ticket categorization so incidents reach the right team faster.
- Build knowledge base articles for recurring issues.
- Use automation for password resets, access requests, and simple fixes.
- Track recurring incidents and connect them to problem management.
3. First Contact Resolution (FCR)
Definition: First Contact Resolution measures the percentage of tickets resolved during the first interaction, without escalation, follow-up, or reassignment.
Why it matters: FCR is a strong indicator of service desk maturity. When users get the right answer the first time, satisfaction usually improves and the team spends less time handling repeat contacts.
HDI lists First Contact Resolution Rate as one of the short list of service and support KPIs that really matter, alongside cost per ticket, customer satisfaction, agent utilization, first level resolution, and agent job satisfaction. HDI also explains that increasing FCR can increase customer satisfaction.
You can reference HDI’s service and support KPI benchmarking guidance when discussing the relationship between FCR and customer satisfaction.
Formula:
FCR = Tickets resolved on first contact / Total tickets × 100
How to improve FCR:
- Give frontline agents better access to knowledge articles and asset data.
- Create templates for common requests and incidents.
- Train agents on the most frequent issue categories.
- Review escalated tickets to identify avoidable handoffs.
4. SLA Compliance Rate
Definition: SLA Compliance Rate measures the percentage of tickets resolved within agreed service level targets.
Why it matters: SLA compliance helps you understand whether your IT team is meeting service expectations. It also gives leaders a clearer way to manage priority levels, staffing, and workload.
SolarWinds identifies SLA Compliance Ratio as an ITSM metric that helps ensure obligations are met without unnecessary loss of productivity or revenue opportunities.
Formula:
SLA Compliance Rate = Tickets resolved within SLA / Total SLA-bound tickets × 100
How to improve SLA compliance:
- Define realistic SLA targets by ticket priority and service type.
- Use automated SLA alerts before deadlines are breached.
- Monitor aging tickets and backlog daily.
- Review SLA breaches to identify process or staffing gaps.
5. Change Success Rate
Definition: Change Success Rate measures the percentage of changes implemented without causing incidents, disruption, emergency fixes, or rollbacks.
Why it matters: Change success rate is one of the most important ITSM KPIs for stability. A high rate suggests your team is assessing risk properly, communicating changes clearly, and deploying updates in a controlled way.
In ITIL 4, this connects closely to Change Enablement. The goal is not to slow teams down. The goal is to help them make successful changes by assessing risk, authorizing the right changes, and managing change schedules effectively.
For added authority, you can link this section to PeopleCert’s ITIL 4 Change Enablement information.
Formula:
Change Success Rate = Successful changes / Total changes × 100
How to improve change success rate:
- Classify changes by risk, urgency, and business impact.
- Use approval workflows for high-risk changes.
- Document rollback plans before deployment.
- Review failed changes and emergency changes after implementation.
6. Ticket Reopen Rate
Definition: Ticket Reopen Rate measures how often tickets are marked as resolved but later reopened by the user or support team.
Why it matters: A low resolution time may look good on a dashboard, but a high reopen rate can reveal that issues are being closed too quickly. This KPI helps you balance speed with quality.
SolarWinds defines reopen rate as the percentage of tickets revisited after being marked as resolved, and notes that high reopen rates can reveal training opportunities or deeper hardware and application problems.
Formula:
Ticket Reopen Rate = Reopened tickets / Closed tickets × 100
How to improve reopen rate:
- Require clear resolution notes before closing tickets.
- Confirm the fix with the user when appropriate.
- Review reopened tickets by category, agent, and root cause.
- Improve knowledge base content for recurring reopen patterns.
7. Incident Volume by Category
Definition: Incident Volume by Category shows how many incidents are created for each issue type, application, department, location, or service area.
Why it matters: This metric helps you identify where demand is coming from. If password resets, access requests, application errors, device issues, or onboarding tasks dominate your queue, you can decide where automation and documentation will have the greatest impact.
Formula:
Incident Volume by Category = Number of incidents in a category during a defined period
How to improve this metric:
- Standardize ticket categories and subcategories.
- Use required fields for service, impact, and issue type.
- Review category trends monthly.
- Turn high-volume recurring categories into self-service or automation opportunities.
8. Self-Service Deflection Rate
Definition: Self-Service Deflection Rate measures how often users solve issues through a portal, knowledge base, chatbot, or automated workflow without opening a ticket.
Why it matters: Self-service is one of the best ways to reduce repetitive ticket volume while giving users faster access to answers. This metric is especially useful if your ITSM strategy includes a knowledge base or service portal.
Formula:
Self-Service Deflection Rate = Self-service resolutions / Total support interactions × 100
How to improve self-service deflection:
- Create knowledge articles for the most common tickets.
- Add clear request forms to your ITSM self-service portal.
- Track failed searches to find missing content.
- Use chatbot suggestions carefully and monitor escalation quality.
For stronger internal linking, this section should link to your future article about how to build an ITSM self-service portal.
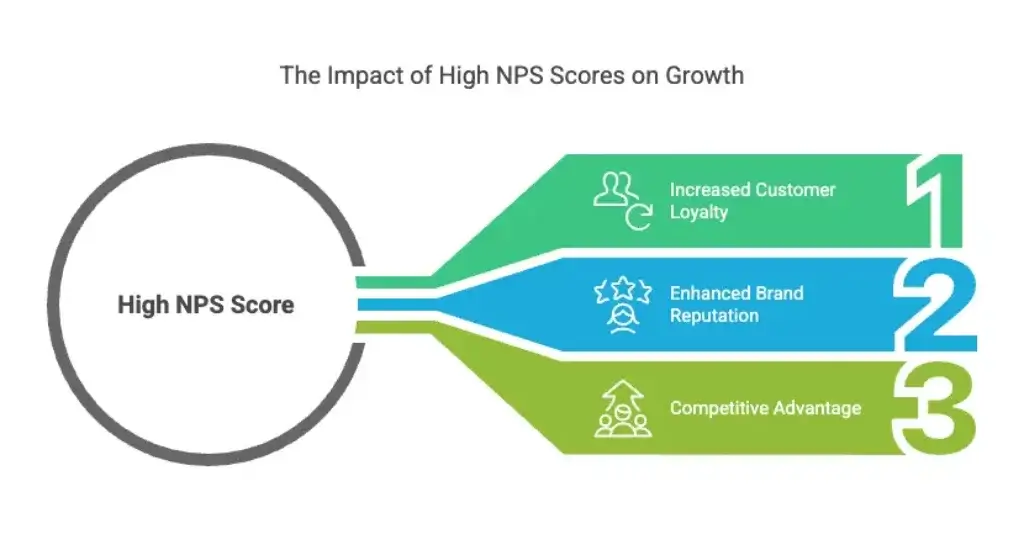
9. Customer Satisfaction (CSAT) and Net Promoter Score (NPS)
Definition: CSAT measures how satisfied users are after a specific interaction. NPS measures how likely users are to recommend your service, product, or organization.
Why it matters: Operational metrics show what happened inside the service desk. CSAT and NPS show how users experienced the service.
CSAT is usually more useful for day-to-day ITSM performance because it can be tied directly to ticket closure, service requests, and support interactions. NPS is broader and can help you understand long-term loyalty, trust, or sentiment toward IT services.
Instead of treating NPS as a standalone growth claim, use it as a supporting experience metric. You can link to the Net Promoter System explanation for a general overview of how NPS is measured.
Formulas:
CSAT = Positive survey responses / Total survey responses × 100
NPS = Percentage of promoters – Percentage of detractors
How to improve CSAT and NPS:
- Send short surveys after ticket closure.
- Ask one open-ended question to capture context.
- Review negative feedback with ticket history.
- Act on repeated feedback patterns, not isolated comments only.
10. ITSM ROI and Cost Per Ticket
Definition: ITSM ROI measures the financial return of your ITSM investments. Cost Per Ticket measures the average cost of handling each support ticket.
Why it matters: These financial ITSM metrics help you explain the business value of service management. They are especially useful when you are justifying new ITSM software, automation, knowledge management, or service desk staffing.
SolarWinds explains that cost per ticket is calculated by dividing service desk operating expenses by total ticket volume during a given period. It also warns that lowering cost without protecting service quality can hurt user experience, so this KPI should always be viewed alongside CSAT, FCR, reopen rate, and SLA compliance.
Formulas:
Cost Per Ticket = Total service desk operating cost / Total ticket volume
ITSM ROI = (Financial benefit – ITSM cost) / ITSM cost × 100
How to improve financial ITSM metrics:
- Automate high-volume repetitive tasks.
- Improve self-service for common requests.
- Reduce ticket rework and unnecessary escalations.
- Consolidate tools where it improves visibility and efficiency.
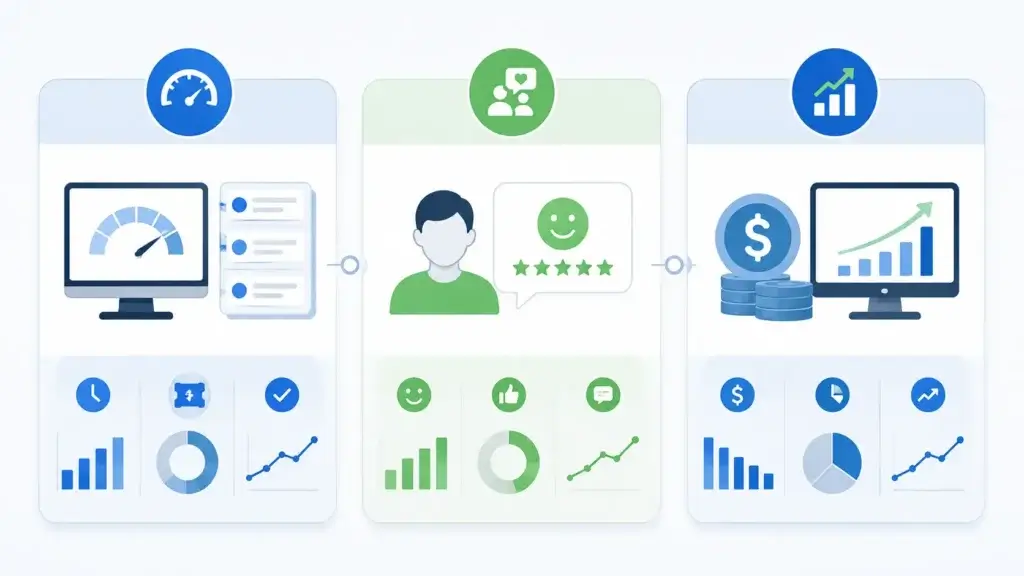
ITSM KPI Categories
Operational, Experience, and Financial Metrics
To build a balanced measurement strategy, you should group ITSM KPIs into three main categories: operational efficiency, customer satisfaction, and financial performance.
Operational metrics help you understand how efficiently IT work is handled. Customer satisfaction metrics show how users experience IT services. Financial metrics help you measure cost, return, and resource efficiency.
To summarize, here is a comparison table of the main aspects of the three types of ITSM KPIs:
| Aspect | Operational Efficiency KPIs | Customer Satisfaction KPIs | Financial KPIs |
| Purpose | Measure how efficiently IT services are delivered | Measure user experience and service quality | Measure cost efficiency and business value |
| Common Metrics | MTTA, MTTR, FCR, SLA compliance, reopen rate | CSAT, NPS, CES, survey response trends | Cost per ticket, ITSM ROI, budget variance |
| Best For | Service desk managers and IT operations teams | IT leaders focused on employee or customer experience | CIOs, finance teams, and IT budget owners |
| Main Risk | Optimizing speed without improving quality | Collecting feedback without acting on it | Reducing cost while damaging service quality |
| Example Goal | Reduce average resolution time by 15% | Improve CSAT after ticket closure | Lower cost per ticket through self-service |
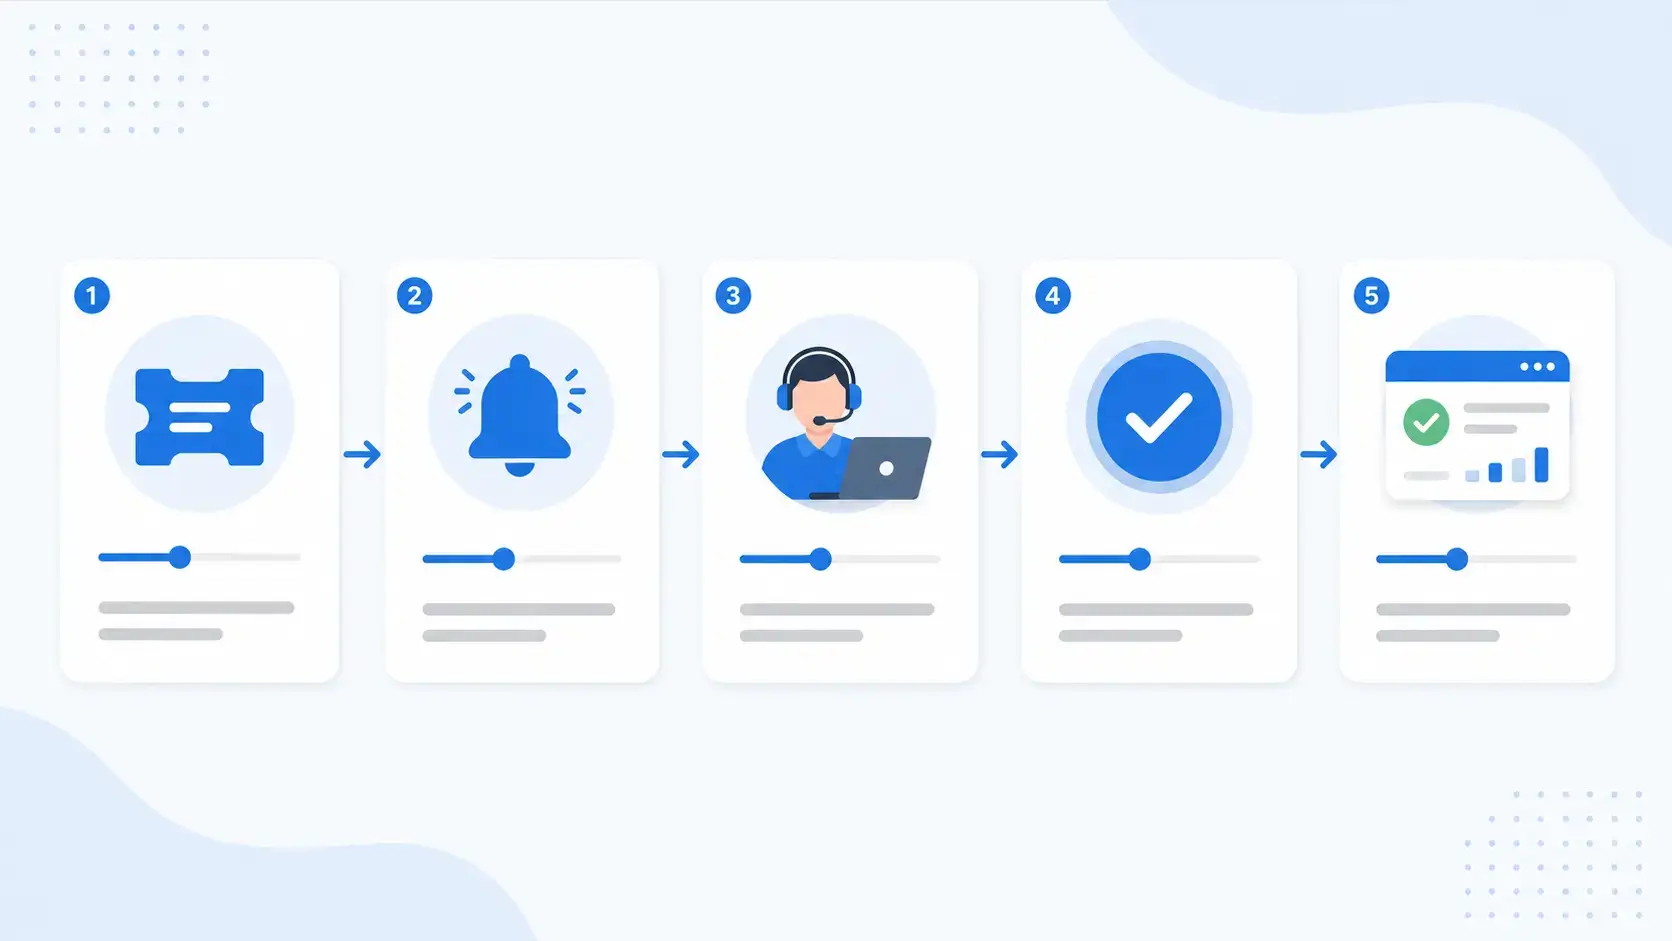
How to Measure ITSM Metrics Effectively
ITSM measurement works best when your metrics are consistent, relevant, and easy to act on. A dashboard full of numbers is not enough. You need to know what each KPI means, who owns it, and what action should happen when the number changes.
Start with business goals
Before choosing KPIs, define what you want to improve. Your goal may be faster service restoration, better employee experience, lower support costs, fewer failed changes, or higher self-service adoption.
Once the goal is clear, choose KPIs that directly support it. For example, if your goal is to improve service reliability, MTTR, SLA compliance, reopen rate, and change success rate are more useful than total tickets closed.
Set baselines before targets
A KPI target is only useful if you know your current performance. Start by measuring your baseline for a defined period, such as 30, 60, or 90 days.
Then create practical improvement targets. For example, you may aim to reduce MTTR by 10%, improve SLA compliance by 5%, or reduce reopen rate over the next quarter.
Use formulas consistently
Make sure each KPI is calculated the same way across teams and reports. If one team measures resolution time in business hours and another uses clock hours, your reports will become difficult to compare.
Document how each KPI is calculated, what data source is used, and whether exceptions are excluded.
Review metrics in context
Never evaluate a KPI in isolation. A lower cost per ticket may look good, but not if customer satisfaction drops. A shorter resolution time may look positive, but not if reopen rate increases.
The best ITSM reporting combines speed, quality, user experience, and cost.
✅ Compare ITSM Solutions in Our Full Guide
How to Choose the Right ITSM KPIs for Your Business
The right ITSM KPIs depend on your business size, service maturity, support volume, compliance needs, and IT operating model. A small IT team does not need the same dashboard as a large enterprise service desk.
For small IT teams
If your team is small, focus on a few core metrics that show workload, responsiveness, and user experience.
- Ticket volume
- MTTA
- MTTR
- SLA compliance
- CSAT
These metrics give you enough visibility without creating reporting overhead.
For growing service desks
As support volume increases, you need metrics that reveal repeat issues, escalation patterns, and knowledge gaps.
- FCR
- Ticket reopen rate
- Incident volume by category
- Backlog size
- Self-service deflection rate
This helps you decide where to add automation, improve training, or expand your knowledge base.
For enterprise IT teams
Enterprise teams should connect service quality with financial and governance metrics.
- Change success rate
- Emergency change rate
- Cost per ticket
- ITSM ROI
- Major incident frequency
These KPIs help leadership understand risk, cost, and business impact.
For regulated industries
If you operate in a regulated environment, you should add metrics that support audit readiness and compliance.
- Change approval compliance
- Security incident response time
- Audit trail completeness
- SLA breach reports
- Policy exception tracking
In these environments, your KPIs should show not only performance, but also control, accountability, and traceability.
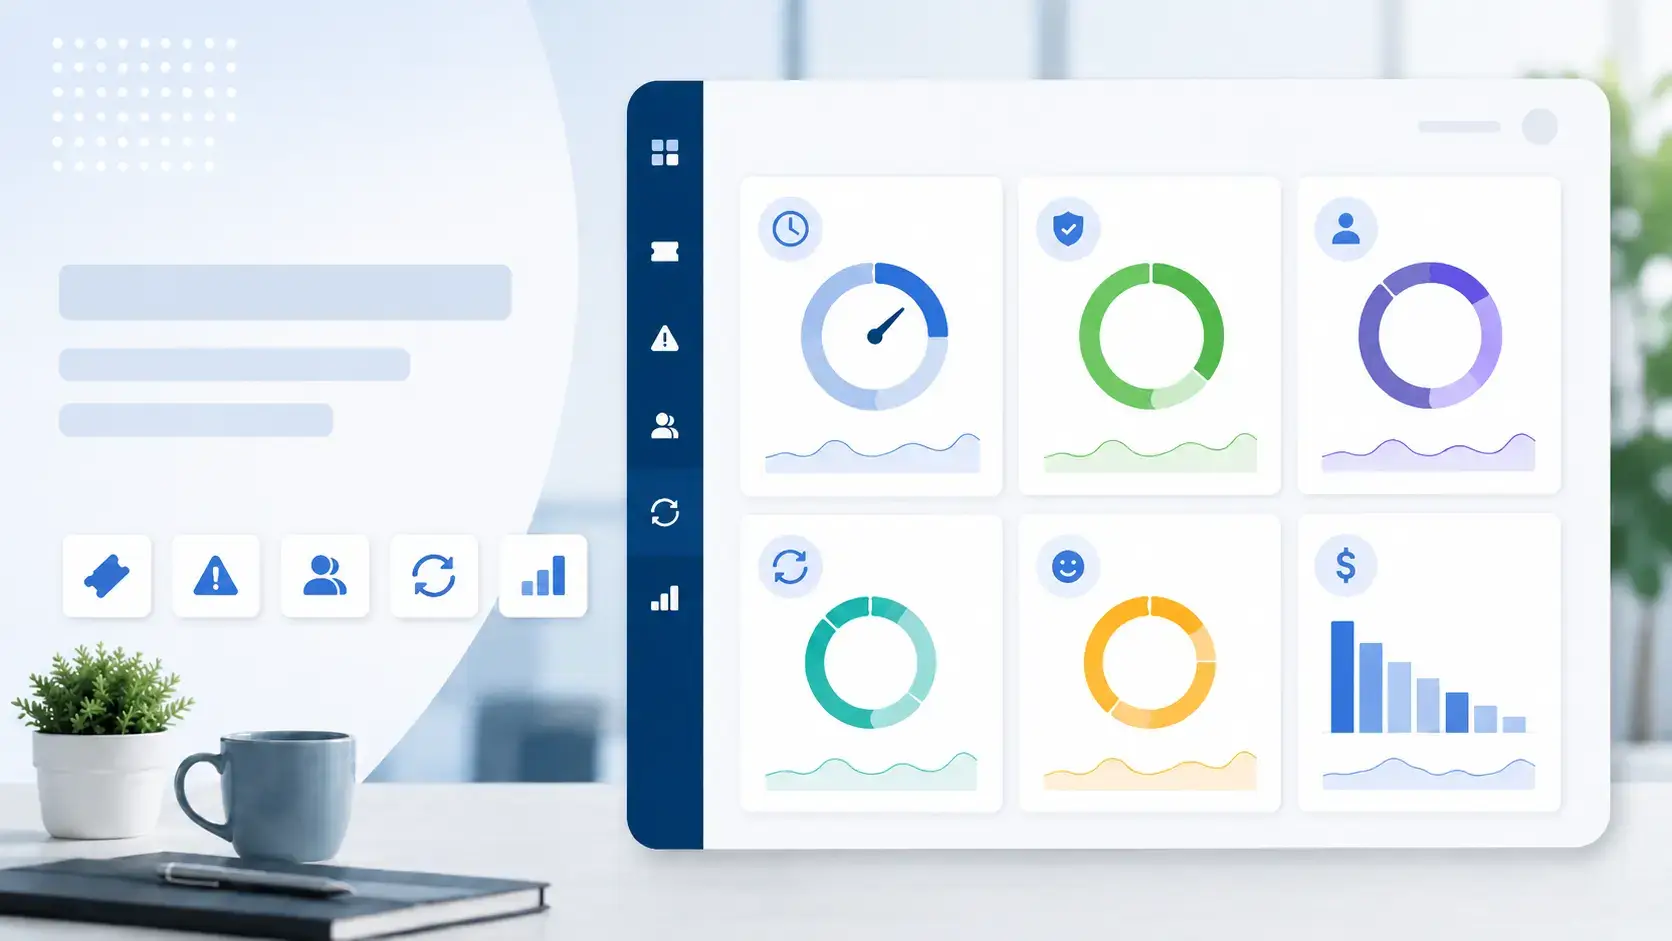
How to Build an ITSM KPI Dashboard
An ITSM dashboard should make performance easy to understand at a glance. The goal is not to show every possible metric. The goal is to give each audience the information they need to make better decisions.
Executive dashboard
An executive ITSM dashboard should focus on business impact, cost, risk, and user satisfaction.
- CSAT and NPS
- SLA compliance
- Major incidents
- Cost per ticket
- ITSM ROI
Service desk manager dashboard
A service desk manager needs visibility into workload, speed, quality, and team performance.
- Open tickets
- Ticket backlog
- MTTA and MTTR
- FCR
- Reopen rate
Change manager dashboard
A change manager needs to understand whether changes are being delivered safely and predictably.
- Change success rate
- Failed changes
- Emergency changes
- Incidents caused by change
- Pending approvals
Self-service dashboard
A self-service dashboard helps you understand whether users are actually finding answers without creating tickets.
- Portal visits
- Knowledge article views
- Successful searches
- Failed searches
- Self-service deflection rate
Common ITSM Metrics Mistakes to Avoid
ITSM metrics can improve service quality, but only when they are selected and interpreted carefully. Poor measurement can push teams toward the wrong behavior.
Tracking too many metrics
When everything is measured, nothing feels important. Start with a focused KPI set and expand only when the team can act on the data.
Using vanity metrics
Total tickets closed may look impressive, but it does not prove that service quality improved. Pair activity metrics with quality metrics such as CSAT, FCR, reopen rate, and SLA compliance.
Ignoring qualitative feedback
Numbers do not always explain why users are frustrated. Review survey comments, ticket notes, and recurring complaint themes alongside dashboard data.
Measuring speed without quality
Faster resolution is valuable only when the issue is truly fixed. If MTTR improves but reopen rate rises, the team may be closing tickets too quickly.
Forgetting to update KPI targets
Your KPI targets should evolve as your service desk matures. A goal that made sense during implementation may become too easy, too difficult, or irrelevant later.
Best ITSM Tools for Tracking Metrics and KPIs
The right ITSM software should help you collect, visualize, and act on KPI data without relying on manual spreadsheets. Look for dashboards, SLA tracking, automation logs, custom reports, survey tools, change records, and knowledge base analytics.
monday service
monday service is a strong fit for teams that want flexible service workflows, AI-supported request handling, automation, and reporting in one connected platform. monday describes monday service as an AI-first service management platform that helps teams manage requests from intake and triage to resolution and reporting.
This makes it useful for teams that want to track service requests, automate repetitive work, and connect IT service workflows with broader business operations.
Freshservice
Freshservice is a good option for IT teams that want built-in reporting and analytics. Freshworks highlights custom ITSM reports, KPI tracking, and data visualization for improving service desk performance.
It is especially relevant if your team wants to monitor MTTR, SLA compliance, ticket trends, and service desk performance through ready-made dashboards.
Jira Service Management
Jira Service Management is particularly useful when ITSM needs to connect with software delivery, DevOps, and change workflows. Atlassian notes that Jira Service Management includes a native change management workflow for recording, assessing, approving, and implementing change requests.
This makes it a strong option for tracking change success rate, change approvals, incidents caused by change, and deployment-related service impact.
ManageEngine ServiceDesk Plus
ManageEngine ServiceDesk Plus is a practical choice for organizations that need structured reporting and dashboards. ManageEngine highlights 150+ reports, custom dashboards, and real-time metrics such as open incidents, request inflow, and overdue tasks.
This makes it useful for teams that want broad ITSM reporting across incidents, requests, SLAs, assets, and service desk workload.
InvGate Service Management
InvGate Service Management can fit teams that want a user-friendly ITSM platform with reporting across incidents, requests, assets, and service workflows. It is a practical option when ease of adoption matters as much as deep configuration.
SysAid
SysAid is relevant for teams that want to automate repetitive service desk tasks and improve ticket handling. It can be mentioned naturally in the context of improving response time, routing, and service desk productivity.
SolarWinds Service Desk
SolarWinds Service Desk is a useful option to mention when discussing incident tracking, service desk metrics, and asset-aware ITSM workflows. SolarWinds also provides useful educational content on ITSM metrics such as MTTR, FCR, SLA compliance, reopen rate, and cost per ticket.
Conclusion
ITSM metrics and KPIs help you move from reactive support to measurable service improvement. When you track the right metrics, you can see where service is slowing down, where users are frustrated, where changes create risk, and where automation or self-service can reduce unnecessary work.
The most effective ITSM measurement strategy includes a balanced mix of operational, experience, and financial KPIs. Metrics like MTTA, MTTR, FCR, SLA compliance, reopen rate, change success rate, CSAT, self-service deflection, and cost per ticket all tell part of the story.
The key is to connect each KPI to a clear business goal. Do not measure numbers simply because your ITSM tool can report them. Measure what helps your team make better decisions, improve service quality, and prove the value of IT to the wider organization.
As your ITSM strategy matures, continue reviewing your KPI set. The right metrics should help you improve processes, support users more effectively, and build a service management model that is ready for 2026 and beyond.
What are ITSM metrics?
ITSM metrics are measurable data points that show how IT services are performing. They can include response time, resolution time, SLA compliance, ticket volume, customer satisfaction, and cost per ticket.
What is the difference between ITSM metrics and KPIs?
ITSM metrics measure service activity or performance. ITSM KPIs are the most important metrics tied to specific business goals, such as improving resolution speed, reducing cost, or increasing user satisfaction.
What are the most important ITSM KPIs?
The most important ITSM KPIs include MTTA, MTTR, first contact resolution, SLA compliance, ticket reopen rate, change success rate, CSAT, self-service deflection rate, and cost per ticket.
What is MTTR in ITSM?
MTTR stands for Mean Time to Resolve. It measures the average time it takes to resolve an incident after it is reported, helping teams understand how quickly service is restored.
What is first contact resolution in ITSM?
First contact resolution measures the percentage of tickets resolved during the first interaction without escalation or follow-up. It is a useful indicator of support quality and agent effectiveness.
How do you measure ITSM performance?
You measure ITSM performance by tracking a balanced set of KPIs across speed, quality, user satisfaction, service reliability, change management, and cost efficiency.
What is change success rate?
Change success rate measures the percentage of changes implemented without causing incidents, disruptions, emergency fixes, or rollbacks. It helps assess change management maturity.
What ITSM metrics should executives track?
Executives should focus on high-level metrics such as SLA compliance, customer satisfaction, major incident frequency, cost per ticket, ITSM ROI, and change success rate.
How do ITSM tools help with KPI tracking?
ITSM tools help by collecting ticket data, tracking SLAs, generating dashboards, automating reports, measuring satisfaction, and showing trends across incidents, requests, and changes.
How often should ITSM KPIs be reviewed?
Operational KPIs should usually be reviewed weekly or monthly, while strategic KPIs such as ROI, CSAT trends, and service improvement progress can be reviewed quarterly.