
Introduction
Amplitude Analytics is a digital analytics platform designed to help you understand how people behave across websites, applications, digital products, and customer journeys.
Instead of limiting analysis to pageviews, traffic sources, or static dashboards, Amplitude organizes data around users, events, properties, sessions, accounts, cohorts, and outcomes. This makes it particularly useful when you need to investigate activation, feature adoption, conversion, engagement, retention, monetization, and churn.
The platform has also expanded well beyond traditional product analytics. Amplitude now combines behavioral analysis with session replay, heatmaps, experimentation, feature flags, in-app guides, surveys, customer activation, data governance, warehouse integrations, and AI agents.
The main tradeoff is that Amplitude is only as reliable as its instrumentation. Autocapture can help you collect data quickly, but meaningful analysis still requires a clear event taxonomy, consistent user identification, validated properties, defined business metrics, and ongoing data governance.
This Amplitude Analytics review examines product analytics, funnels, retention, behavioral cohorts, session replay, experimentation, AI capabilities, data management, pricing, security, integrations, implementation requirements, and alternatives.
How We Evaluated Amplitude Analytics
The evaluation follows the complete product analytics lifecycle. It begins with data collection and taxonomy planning, then assesses behavioral exploration, reporting, qualitative analysis, experimentation, activation, governance, collaboration, security, and scalability.
The assessment draws on current Amplitude product documentation, public pricing information, implementation guidance, security materials, platform updates, and recurring themes in verified customer feedback. Scores represent practical product fit rather than the number of features listed on a pricing page.
Quick Assessment
Amplitude Analytics Review Summary
Amplitude is one of the most complete product analytics platforms available. Its strongest advantage is not any individual chart. It is the way behavioral analytics, session replay, experimentation, guides, surveys, activation, governance, and AI share the same event and user foundation.
You can identify where users abandon an onboarding funnel, create a cohort of affected users, watch relevant session replays, test an alternative experience, and measure whether the change improves activation without manually rebuilding the audience in several disconnected tools.
Amplitude is particularly valuable for product-led SaaS companies, consumer applications, ecommerce businesses, subscription services, media platforms, marketplaces, and digital teams that need deeper behavioral insight than conventional web analytics provides.
It is less suitable when you only need basic website traffic reporting, your organization cannot dedicate resources to analytics implementation, or your primary requirement is financial and operational reporting across accounting, CRM, ERP, and warehouse data.
Amplitude Analytics at a Glance
| Category | Amplitude Assessment |
| Best For | Product, growth, data, and marketing teams analyzing digital customer behavior |
| Overall Score | 9.2/10 |
| Ease of Use | 8.4/10 |
| Product Analytics | 9.7/10 |
| Session Replay | 9.0/10 |
| Experimentation | 9.2/10 |
| AI Capabilities | 9.1/10 |
| Data Governance | 9.2/10 |
| Starting Price | Free for up to 2 million events per month |
| Main Strength | Deep behavioral analytics connected with replay, experimentation, and activation |
| Main Limitation | Reliable results require careful instrumentation, taxonomy, and identity management |
Recommendation: Amplitude is easy to recommend when product behavior is central to your growth strategy and you are prepared to treat analytics implementation as a managed data product. The free plan offers a practical way to evaluate the platform, while Growth and Enterprise plans support more advanced exploration, governance, experimentation, security, and organizational scale.
Platform Overview
What Is Amplitude Analytics?
Amplitude is a digital analytics platform for collecting customer interaction data, analyzing behavioral patterns, investigating digital experiences, testing product changes, and activating audiences.
The platform uses event-based analytics. An event represents an action, such as creating an account, viewing a product, inviting a teammate, completing onboarding, starting a subscription, or using a feature.
Properties add context to those actions. You might attach device type, subscription plan, acquisition channel, product category, company size, geographic region, or experiment variant to an event or user.
Where Amplitude Fits in Your Analytics Stack
Amplitude typically sits between your digital products and the teams making product, growth, marketing, design, and customer-experience decisions.
Websites and applications send behavioral events through Amplitude SDKs, APIs, Autocapture, customer data platforms, warehouses, or cloud integrations. Amplitude then turns those events into funnels, retention analyses, journeys, cohorts, dashboards, replays, experiments, and targeted audiences.
A data warehouse can remain the central system for cross-functional reporting and historical modeling. Amplitude is better positioned as the self-service behavioral analysis layer, while tools such as Power BI and Tableau are usually better for financial, operational, and company-wide business intelligence.
Who Should Use Amplitude?
- Product teams: Measure feature adoption, onboarding, engagement, retention, and release impact.
- Growth teams: Find conversion friction and test improvements across acquisition and activation funnels.
- Data teams: Provide governed behavioral data without answering every product question manually.
- Marketing teams: Connect campaigns with downstream product behavior, retention, and revenue outcomes.
- Digital businesses: Analyze customer journeys across web, mobile, subscriptions, and accounts.
Who May Prefer Another Analytics Platform?
A simpler web analytics tool may be enough when you mainly need traffic sources, landing-page performance, campaign attribution, and standard ecommerce reporting.
You may also prefer a dedicated BI platform when your priority is combining accounting, CRM, operations, inventory, and financial data into executive dashboards. Read the Power BI review or Tableau review for broader reporting use cases.
Key Features
Behavioral Analytics, Replay, Experiments, and AI
Amplitude’s feature set covers the full cycle from collecting behavioral data to finding an insight, validating the customer experience, testing a solution, and targeting the resulting audience.
Event Segmentation and Behavioral Analysis
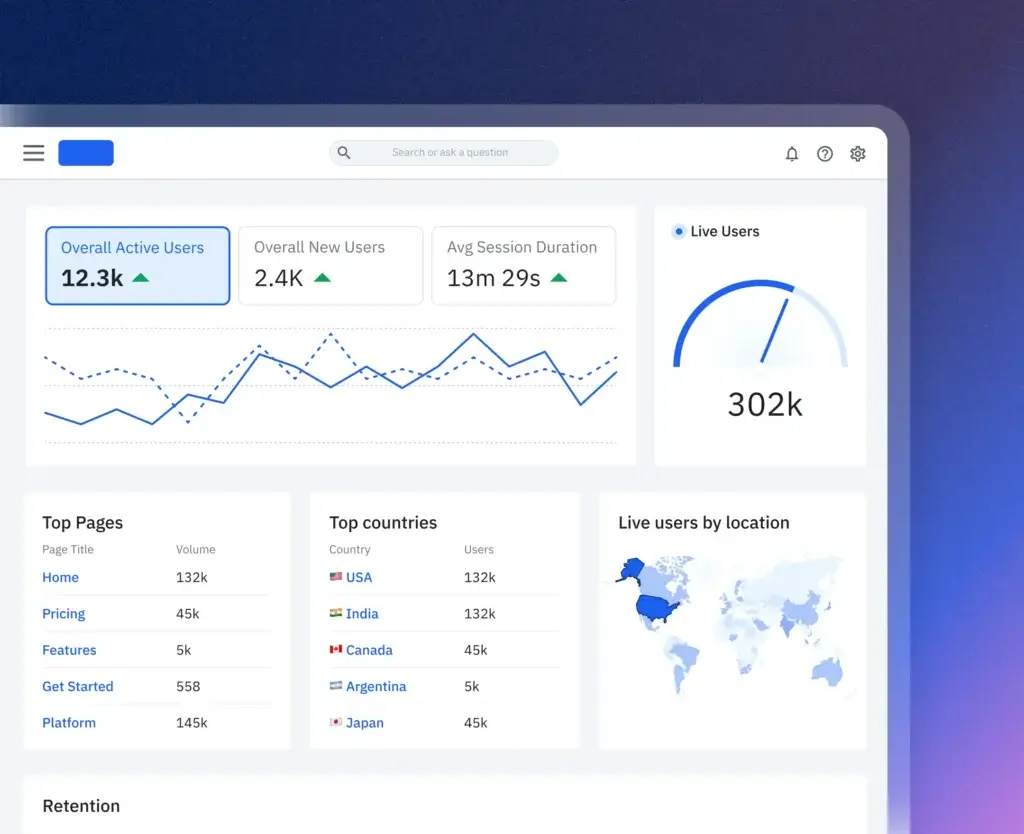
Event Segmentation is the foundation of Amplitude analysis. You can count events, unique users, active users, averages, frequencies, percentages, sums, and calculated formulas over time.
Events can be broken down by user or event properties, compared across segments, and filtered using behavioral conditions. This lets you move from a broad metric such as weekly active users to a more specific question about which subscription plans, devices, campaigns, or behaviors explain a change.
Funnels and Conversion Analysis
Funnels measure how users progress through a defined sequence. Common examples include account creation, onboarding, checkout, upgrading, inviting collaborators, or publishing a first project.
You can compare conversion across cohorts, identify the steps with the highest abandonment, examine time to convert, and investigate the behaviors that happen between steps.
The most useful funnels reflect moments where a user receives value. Tracking every screen in a process may create a technically detailed report without revealing which changes would improve the customer outcome.
Journeys and Path Analysis
Journeys help you discover the paths users take before or after an important action. This is useful when the real customer journey does not follow the path your team expected.
You can use path analysis to identify repeated loops, unexpected navigation, alternate routes to conversion, and behaviors that commonly precede churn or disengagement.
Retention, Stickiness, and Lifecycle Analysis
Amplitude is particularly strong at retention analysis. You can measure how frequently users return after performing a starting action, compare retention curves, and identify behaviors associated with longer-term engagement.
Lifecycle analysis separates active users into new, current, resurrected, and dormant groups. Stickiness analysis shows how many days, weeks, or months users perform an important event.
Together, these views help you distinguish temporary acquisition growth from sustainable product adoption.
Behavioral Cohorts and Account Analytics
Behavioral cohorts group users based on actions, properties, sequences, frequency, or inactivity. A cohort might include users who completed onboarding but never invited a colleague, customers who used a premium feature three times, or subscribers who stopped performing a critical event.
Cohorts can be reused in analysis, experiments, guides, surveys, replay investigation, and downstream marketing tools. Growth and Enterprise customers can also add account-level analytics for B2B products that need to measure companies, workspaces, teams, or subscriptions rather than only individual users.
Session Replay and Heatmaps
Session Replay adds qualitative context to quantitative analysis. When a funnel shows a drop, you can watch relevant sessions to see whether users encountered confusing navigation, errors, slow responses, repeated clicks, or unclear interface elements.
Because replay is connected with Amplitude’s events and cohorts, you can narrow recordings to users who experienced a specific outcome instead of reviewing random sessions.
Heatmaps provide a faster overview of clicks and interaction patterns. Replay volumes and retention depend on your subscription and any expanded package you purchase.
Feature Experimentation and Feature Management
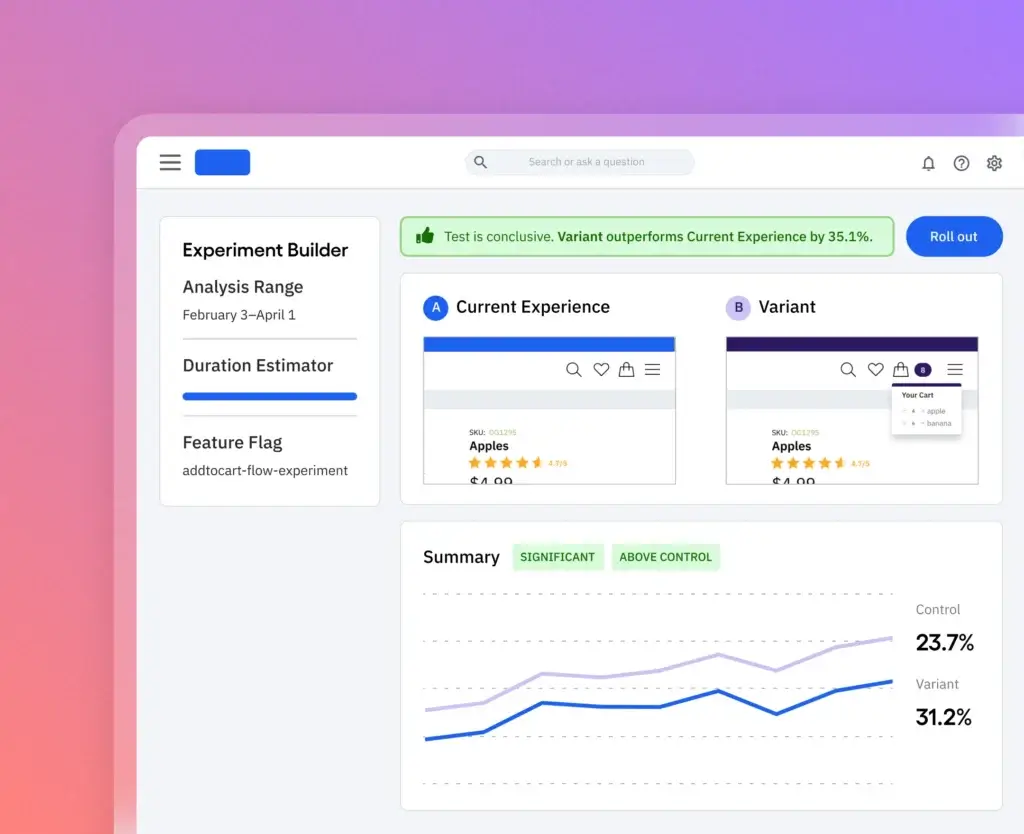
Amplitude Feature Experimentation uses feature flags and experimentation SDKs to test product changes. You can target variants, define exposure, select metrics, evaluate impact, and roll features out gradually.
Advanced packages support capabilities such as multi-armed bandits, stratified sampling, sticky bucketing, approval workflows, holdout groups, and mutually exclusive experiments.
Feature flags can also be used without a formal experiment when you need controlled releases, staged deployment, entitlement management, or risk reduction.
Web Experimentation
Web Experimentation provides a visual editor for creating website A/B tests and multi-armed bandit experiments. It is designed for marketing, growth, and product teams that want to test copy, page elements, layouts, and conversion experiences with less engineering involvement.
You should still involve developers for complex single-page applications, dynamic components, identity logic, performance-sensitive experiences, and experiments that change business rules.
Guides, Surveys, and Customer Activation
Guides and Surveys let you create onboarding flows, product tours, announcements, NPS surveys, microsurveys, and contextual messages.
The important differentiator is behavioral targeting. Instead of displaying the same popup to every visitor, you can target users based on what they have done, what they have not done, the cohort they belong to, or the friction they appear to be experiencing.
Amplitude Activation extends this idea by syncing cohorts and behavioral data to external engagement, advertising, messaging, and customer systems.
Amplitude AI Agents and AI Assistance
Amplitude AI Agents are designed to investigate metrics, create analyses, generate charts and dashboards, monitor changes, summarize sessions, organize data, and connect insights with external work tools.
The Global Agent supports conversational analysis across the platform. Custom Agents can be configured for recurring jobs, while specialized agents focus on workflows such as session replay investigation or experimentation.
Amplitude MCP also lets supported AI tools access governed Amplitude context. AI can reduce the time required to begin an investigation, but it does not correct weak instrumentation, ambiguous metrics, or incomplete identity resolution.
Amplitude Data and Taxonomy Governance
Amplitude Data provides a shared tracking plan for events and properties. You can define naming standards, add descriptions, validate incoming data, identify unexpected fields, transform events, create derived properties, and monitor schema health.
The Ampli developer toolkit can generate type-safe tracking libraries from the approved plan. This helps product, engineering, and analytics teams maintain the same definition of each event rather than relying on spreadsheets that become outdated.
Amplitude Feature Overview
| Feature Area | What Amplitude Provides | Best For |
| Product Analytics | Segmentation, funnels, journeys, retention, lifecycle, stickiness, and cohorts | Understanding digital behavior |
| Experience Analytics | Session replay, heatmaps, and friction investigation | Explaining conversion and usability problems |
| Experimentation | Feature flags, product experiments, web experiments, and release controls | Testing product and website changes |
| Engagement | Guides, tours, surveys, announcements, and behavioral targeting | Onboarding and feature adoption |
| Activation | Behavioral cohort syncs, APIs, and real-time destinations | Personalized campaigns and workflows |
| AI | Global Agent, custom agents, replay analysis, AI feedback, and MCP | Accelerating analysis and recurring research |
| Data Governance | Tracking plans, schema validation, transformations, observability, and access controls | Maintaining trusted analytics |
Pros and Cons
Benefits and Limitations
Positive
✅ Deep behavioral analytics
✅ Connected insight-to-action workflow
✅ Strong free plan
✅ Advanced data governance
Negative
❌ Instrumentation requires planning
❌ Interface can feel dense
❌ Advanced pricing is not transparent
❌ Product packaging is complex
✅ Amplitude Analytics Pros
- Funnels, retention, journeys, lifecycle, and cohorts provide excellent behavioral depth.
- Session replay is directly connected with events, funnels, experiments, and cohorts.
- The free allowance is generous enough for meaningful evaluation and smaller products.
- Experimentation, activation, guides, and surveys reduce dependence on separate platforms.
- Tracking plans, schema controls, and data observability support enterprise governance.
❌ Amplitude Analytics Cons
- Reliable implementation requires engineering, analytics, and product-team coordination.
- Large event taxonomies can make navigation and chart building feel crowded.
- Growth, Enterprise, and advanced product packages require custom pricing.
- Different public pricing pages can make the Plus starting price difficult to interpret.
- Teams may pay for broad platform capabilities they do not plan to use.
Amplitude delivers the most value when you establish ownership for instrumentation, metric definitions, identity management, privacy, taxonomy changes, and dashboard maintenance. Without those practices, even powerful analytics can create conflicting answers.
Getting Started
Instrumentation, Taxonomy, and Adoption
You can start collecting web data quickly with Amplitude’s Browser SDK, a script snippet, Autocapture, or an implementation wizard. Autocapture can collect pageviews, clicks, sessions, form interactions, downloads, and attribution information.
Fast collection should not replace deliberate planning. The most successful implementations define business questions and critical events before sending every possible interaction into the platform.
Recommended Amplitude Implementation Process
- Define the decisions and product questions your analytics must support.
- Identify critical events for acquisition, activation, engagement, retention, and revenue.
- Create consistent event, user-property, and account-property naming standards.
- Decide how anonymous visitors become identified users across devices and sessions.
- Implement Autocapture for rapid visibility and custom events for important outcomes.
- Validate incoming data against the approved tracking plan.
- Build a small set of trusted funnels, retention charts, cohorts, and dashboards.
- Assign ownership for schema changes, metric definitions, privacy, and ongoing monitoring.
Autocapture vs Custom Event Tracking
Autocapture helps you begin quickly and investigate interactions that were not manually tagged. It is useful for website analytics, early exploration, heatmaps, and replay context.
Custom tracking remains important for business events such as completing onboarding, activating an account, publishing content, inviting a team member, upgrading a plan, generating revenue, or reaching a defined success milestone.
A balanced implementation often uses Autocapture for broad interaction visibility and governed custom events for durable product metrics.
Ease of Use by Role
Business users can learn to filter dashboards and inspect standard funnels relatively quickly. Product managers and growth analysts need a deeper understanding of events, properties, cohorts, conversion windows, retention definitions, and identity behavior.
Data teams must also understand SDK implementation, schema governance, warehouse connections, account modeling, permissions, privacy, and the financial impact of event volume.
Customer Support and Education
Amplitude provides developer documentation, product documentation, Amplitude Academy, templates, tracking guides, community discussions, webinars, and implementation resources.
Free users should expect a more self-service experience. Plus adds online support, while larger contracts can include onboarding, customer success, and dedicated services depending on the agreement.
Performance and Scalability
Event Volume, Data Quality, and Scale
Amplitude is designed to analyze high-volume behavioral data, but scalability involves more than query speed. You must also manage event volume, taxonomy complexity, identity resolution, project structure, data retention, replay quotas, integrations, and user permissions.
Event Volume and Cost Control
Amplitude’s current pricing model emphasizes monthly event volume. A single user can generate hundreds or thousands of events, especially when Autocapture, repeated interactions, background events, or overly granular tracking are enabled.
Before scaling, audit which events create analytical value. High-volume events such as scrolling, cursor movement, polling, or repeated system updates may increase cost without improving decisions.
Data Quality and Schema Monitoring
Amplitude Data can compare incoming information with your tracking plan, identify unexpected events and properties, monitor volume changes, and help you clean or transform data.
This becomes increasingly important as several engineering teams instrument the same product. Without a controlled taxonomy, similar actions may appear under several names, properties may change type, and dashboards may depend on events that are no longer maintained.
Warehouse and Hybrid Architectures
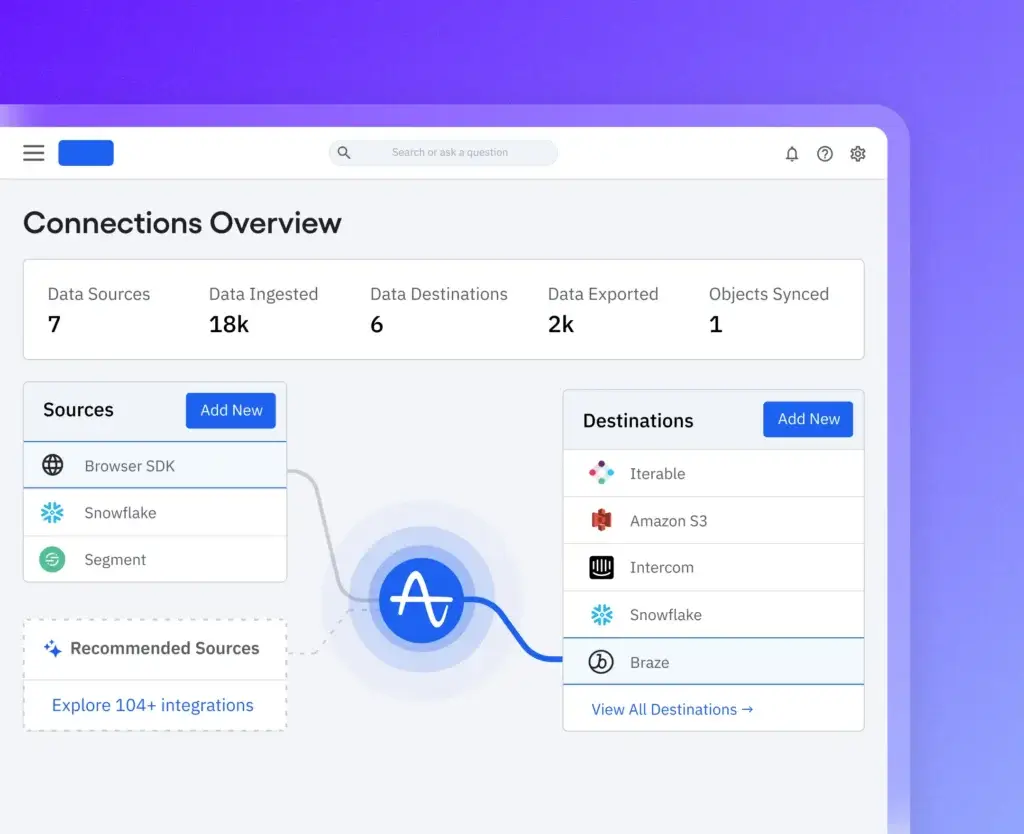
Amplitude can import data from warehouses such as Snowflake, BigQuery, and Databricks. It can also export events to warehouse and storage destinations.
Warehouse-native Amplitude connects directly with supported Snowflake data and runs generated queries in your warehouse. This can help organizations keep governed behavioral and business data close to the existing source of truth, although Snowflake compute costs still apply.
Practical Scalability Checklist
- Track business-relevant events rather than every technical interaction.
- Document user, device, account, and anonymous identity rules.
- Review event volume before enabling broad Autocapture in production.
- Archive, block, or transform events that no longer add value.
- Separate development, testing, and production data appropriately.
- Monitor dashboard ownership and remove outdated analyses.
Real-World Use Cases
Where Amplitude Delivers the Most Value
SaaS Activation and Onboarding
You can define the actions that indicate a new user has received initial value, then measure how many users reach that point and how long it takes.
Funnels show where onboarding breaks down. Cohorts compare activated and non-activated users. Retention analysis tests whether the chosen activation event is associated with continued use. Replay and surveys help explain why users struggle.
Feature Adoption and Product Roadmaps
Amplitude can show which features are discovered, used repeatedly, adopted by valuable accounts, or associated with retention and expansion.
This helps you separate highly requested features from features that create measurable customer value. It can also reveal whether a launch increased engagement or simply moved activity from an existing workflow.
Ecommerce and Subscription Conversion
Ecommerce teams can analyze product discovery, cart behavior, checkout, payment failures, purchases, repeat orders, and subscription upgrades.
Journeys reveal unexpected paths to purchase, while replay provides context for abandonment. Experiments can then test changes to product pages, checkout steps, pricing messages, recommendations, and promotional experiences.
Mobile Application Engagement
Mobile teams can evaluate install-to-registration conversion, permission prompts, feature discovery, session frequency, subscription behavior, and retention across application versions and devices.
Identity planning is especially important when users interact anonymously before creating an account or use the product across web and mobile environments.
B2B Account and Workspace Analytics
Individual-user metrics can be misleading for collaborative software. A B2B product may need to measure workspace activation, invited teammates, seat utilization, account-wide adoption, administrator behavior, and expansion signals.
Amplitude’s account analytics package supports group-level analysis and experimentation for organizations that need company, workspace, household, or subscription-level reporting.
Marketing and Campaign Quality
Amplitude can connect acquisition sources with downstream product outcomes. This helps you compare campaigns based on activation, feature adoption, retention, and revenue rather than registration volume alone.
Marketing teams should still retain specialized advertising and attribution systems where required, but Amplitude provides a clearer view of what acquired users do after they arrive.
What Users Say About Amplitude
Verified reviewers frequently praise Amplitude’s funnels, retention analysis, event tracking, cohorting, integrations, and ability to answer product questions without waiting for a data analyst.
Common concerns include the initial learning curve, crowded event lists, the effort required to maintain clean instrumentation, and pricing complexity as usage and advanced requirements grow.
Pricing and Plans
How Much Does Amplitude Cost?
Amplitude uses event-based pricing for its current platform plans. All plans advertise unlimited seats, reducing the friction of giving more employees access to analytics.
The current main pricing page describes Plus as starting at $0 with the first 2 million monthly events included. A separate Plus page still states that Plus starts at $49 per month. Because these public statements are not fully aligned, you should use the live pricing estimator and confirm the commercial terms before purchasing.
Amplitude Pricing Plans
| Plan | Current Price Reference | Best For |
| Free | $0 for up to 2 million events per month | Individuals, startups, evaluation, and smaller products |
| Plus | Starts at $0 on the main pricing page and scales with event volume | Small teams finding product-market fit |
| Growth | Custom event-based pricing | Scaling businesses needing advanced exploration, SSO, and monitoring |
| Enterprise | Custom event-based pricing | Large organizations needing RBAC, access controls, and advanced management |
| Expanded Packages | Priced as a percentage of the platform plan | Advanced experimentation, activation, replay, guides, surveys, or B2B analytics |
Amplitude Free
The Free plan includes up to 2 million events per month, basic product analytics, 10,000 monthly session replays, one-time cohort syncs, limited experiments, limited guides and surveys, AI agents, MCP, and a limited number of AI-related records or prompts.
It does not require a credit card and has no published time limit. This makes it a useful option for testing Amplitude with real product data rather than evaluating it through a short trial.
Amplitude Plus
Plus supports higher event volume and adds custom events, formulas, up to 20 behavioral cohorts, alerts, heatmaps, and two-year data retention.
The main pricing page says Plus can scale to 70 million events, although the displayed annual pricing comparison may use lower event tiers. You should model expected production volume rather than estimating cost from current user numbers alone.
Amplitude Growth
Growth adds advanced behavioral exploration, currency conversion, stronger monitoring and alerts, SSO, project permissions, and higher included replay and AI limits.
Pricing is custom, so your contract may depend on event volume, selected products, data retention, implementation requirements, support, and negotiation.
Amplitude Enterprise
Enterprise adds advanced user management, role-based access control, data access controls, unlimited projects within portfolios, additional monitoring, higher replay limits, and enterprise support options.
It is the most appropriate tier when several business units share Amplitude or when sensitive data requires more granular control.
Advanced Packages and Hidden Costs
Growth and Enterprise customers can purchase expanded packages for Feature Experimentation, Web Experimentation, Guides and Surveys, Activation, Session Replay, and account-level analytics.
Amplitude states that these packages are priced as a percentage of the underlying platform plan. This means total cost can rise as your analytics volume and platform contract grow, even when the expanded product’s usage remains stable.
Additional costs may include engineering implementation, taxonomy design, consulting, data cleanup, warehouse compute, customer data infrastructure, privacy reviews, experimentation development, and ongoing analytics administration.
Integrations
Data Sources, Destinations, and Workflow Connections
SDKs, APIs, and Customer Data Platforms
Amplitude provides SDKs for web, mobile, and supported application environments, along with HTTP APIs and developer tools.
Customer data platforms and event pipelines such as Segment and other integration partners can send standardized events to Amplitude while routing the same information to warehouses and downstream systems.
Data Warehouses and Cloud Storage
Amplitude supports connections with platforms including Snowflake, BigQuery, Databricks, Amazon Redshift, Amazon S3, Google Cloud Storage, and Azure Blob Storage.
Available patterns include importing events and properties, exporting raw data, recurring synchronization, event streaming, and warehouse-native analysis for supported Snowflake deployments.
Marketing, Messaging, and Customer Engagement
Behavioral cohorts can be synced to customer-engagement and marketing systems. This allows you to target users who abandoned onboarding, adopted a feature, reached a usage threshold, or appear at risk of churn.
Common integration categories include email automation, push notifications, mobile engagement, advertising audiences, customer support, personalization, surveys, and reverse ETL.
Collaboration and AI Agent Connections
Amplitude Agents can connect with supported work tools such as Slack, Notion, Atlassian products, GitHub, Linear, Sentry, and other MCP-enabled systems.
These connections can add product documents, engineering work, support issues, or team discussions to an investigation and help push findings into the workflow where action happens.
Data Protection
Security, Privacy, and Enterprise Controls
Product analytics data can reveal detailed customer behavior, making privacy and access control important parts of implementation.
Amplitude documents SOC 2 Type 2 controls and provides ISO certification information through its trust resources. Its documentation also addresses GDPR, CCPA, HIPAA-related requirements, data processing agreements, privacy requests, and other compliance considerations.
Access and Governance Controls
- Single sign-on and project permissions on supported paid plans.
- Role-based access control and advanced user management for Enterprise.
- Data Access Control for restricting sensitive properties and classifications.
- User privacy APIs for processing supported deletion requests.
- Tracking controls and SDK opt-out methods for preventing future collection.
Session Replay Privacy
Before enabling replay, you should configure masking, blocking, sampling, and data collection rules. Sensitive fields, authentication data, payment information, private messages, and regulated information should not be captured unless your legal and security teams explicitly approve the configuration.
Amplitude AI Data Use
Amplitude states that it does not train AI models using customer data processed by Amplitude AI Agents. AI features still require appropriate internal review because agents may analyze product data, feedback, documents, sessions, and connected work systems according to the permissions you provide.
Comparison
Amplitude Analytics Alternatives
The best Amplitude alternative depends on whether you prioritize rapid self-service analytics, automatic capture, in-app adoption, developer control, self-hosting, or lower pricing at your expected volume.
Amplitude Alternatives Compared
| Platform | Main Strength | Best Fit |
| Amplitude | Deep behavioral analytics connected with experimentation and activation | Product-led and data-mature digital businesses |
| Mixpanel | Fast self-service product analytics | Teams prioritizing accessible funnels, retention, and reporting |
| Heap | Automatic capture and digital experience analysis | Teams that want broad behavioral collection with less manual tagging |
| Pendo | Product adoption, in-app guidance, and feedback | SaaS teams emphasizing onboarding and customer education |
| PostHog | Developer-first product suite and deployment flexibility | Engineering-led teams wanting integrated development tools |
Amplitude vs Mixpanel
Mixpanel is a strong alternative for teams that want fast event analysis, funnels, retention reporting, cohorts, and dashboards with a relatively approachable workflow.
Amplitude provides broader integration between analytics, replay, experimentation, governance, guides, surveys, activation, and AI agents. Mixpanel may be easier to justify when your primary requirement is focused product analytics rather than a wider digital optimization platform.
Amplitude vs Heap
Heap is known for automatically capturing digital interactions so teams can define and analyze behavior after collection.
Amplitude also provides Autocapture, but its main strength remains structured behavioral analytics and the workflow from cohorts to experimentation and activation. Heap may be preferable when retroactive analysis and broad automatic capture are the leading priorities.
Amplitude vs Pendo
Pendo combines analytics with in-app guides, onboarding, feedback, roadmapping, and product-adoption workflows.
Pendo is particularly attractive when customer education and in-product communication are central. Amplitude generally offers deeper behavioral analysis and a stronger experimentation and data-governance foundation.
Amplitude vs PostHog
PostHog offers a developer-oriented suite that can include product analytics, replay, feature flags, experimentation, surveys, error tracking, and related engineering tools.
PostHog is compelling for technical teams that value transparent usage pricing, APIs, open-source components, or self-hosting options. Amplitude provides a more mature experience for large product and analytics organizations that prioritize self-service exploration and enterprise governance.
For broader executive dashboards, financial reporting, and cross-department business intelligence, review the best business intelligence software.
Final Thoughts
Is Amplitude Analytics Worth It?
Amplitude Analytics is worth considering when digital customer behavior directly influences your product strategy, growth model, and revenue performance.
Its greatest strength is the connection between quantitative analysis and action. You can detect a conversion problem, inspect the affected users, watch their sessions, build a behavioral cohort, run an experiment, and target the resulting audience within one platform.
The analytics capabilities are excellent, particularly for funnels, retention, journeys, cohorts, lifecycle analysis, and feature adoption. Session Replay, experimentation, guides, surveys, activation, Amplitude Data, and AI Agents make the platform substantially broader than a conventional product analytics tool.
The limitation is that Amplitude does not remove the need for analytics discipline. You still need a thoughtful taxonomy, accurate identities, validated events, controlled privacy settings, metric ownership, and an ongoing governance process.
Choose Amplitude when you want deep product analytics and a connected optimization platform. Consider Mixpanel for focused self-service analytics, Heap for automatic capture, Pendo for product adoption and in-app guidance, or PostHog for a developer-first product suite.
Frequently Asked Questions
Have More Questions?
What is Amplitude Analytics?
Amplitude Analytics is an event-based digital analytics platform for analyzing customer behavior, funnels, journeys, feature adoption, engagement, retention, conversion, and product growth.
Is Amplitude Analytics free?
Yes. Amplitude offers a free plan with up to 2 million events per month, basic product analytics, session replay, AI tools, and limited experimentation, guides, and surveys.
How much does Amplitude cost?
The Free plan costs $0. The main pricing page currently lists Plus from $0 with the first 2 million monthly events included. Growth and Enterprise use custom event-based pricing.
Is Amplitude difficult to implement?
Basic web collection is relatively fast with Autocapture and the Browser SDK. A reliable production implementation requires taxonomy planning, identity rules, validation, privacy controls, and ongoing governance.
What is Amplitude Autocapture?
Autocapture collects supported interactions such as pageviews, clicks, sessions, forms, downloads, and attribution data without requiring a separate custom tracking call for every action.
Does Amplitude include session replay?
Yes. Amplitude Session Replay connects recordings with behavioral events, funnels, cohorts, surveys, and experiments. Monthly replay volume and retention depend on your plan and package.
Can Amplitude run A/B tests?
Yes. Amplitude offers feature experimentation using flags and SDKs, plus web experimentation with a visual editor. Advanced experiment capabilities are available through paid packages.
Does Amplitude use artificial intelligence?
Yes. Amplitude provides AI Agents, conversational analysis, replay investigation, AI Feedback, data-governance assistance, generated artifacts, recurring monitoring, and MCP connections.
What are the best Amplitude alternatives?
Leading Amplitude alternatives include Mixpanel for focused self-service analytics, Heap for automatic capture, Pendo for product adoption, and PostHog for developer-first product tooling.
Is Amplitude Analytics worth it?
Amplitude is worth considering when you need deep behavioral analytics connected with replay, experimentation, activation, governance, and AI. It offers less value when you only need basic traffic or executive reporting.