Introduction
Business Intelligence (BI) software has become a game-changer in modern business, empowering organizations to turn raw data into actionable insights. As we head into 2025, the demand for data-driven decision-making is higher than ever, and BI tools have evolved to offer unparalleled power, flexibility, and accessibility. Companies of all sizes, from startups to large enterprises, are leveraging BI solutions to streamline operations, understand customer behavior, optimize strategies, and drive growth.
BI software provides businesses with the tools to collect, analyze, and visualize data, transforming numbers and statistics into stories that inform and inspire. From real-time dashboards that offer instant insights to predictive analytics that help forecast trends, the BI landscape is packed with options designed to suit a variety of needs. Yet, with so many options available, identifying the right tool for your business can be daunting. The right BI software should not only provide insights but also integrate smoothly into your existing workflow, adapt to your company’s unique needs, and empower every level of the organization to make smarter decisions.
In this article, we’ll dive into the 7 best BI software solutions for 2025, highlighting tools that lead the way in innovation, usability, and business impact. From Pyramid Analytics, which ranks at the top for its robust features and intuitive interface, to other industry favorites, we’ll cover each platform’s standout features, strengths, and ideal use cases. Whether you’re looking for seamless Microsoft integration, advanced data visualization, or real-time insights, this list will help you make an informed choice.

Top 7 BI Analytics Software for 2025
Overview:
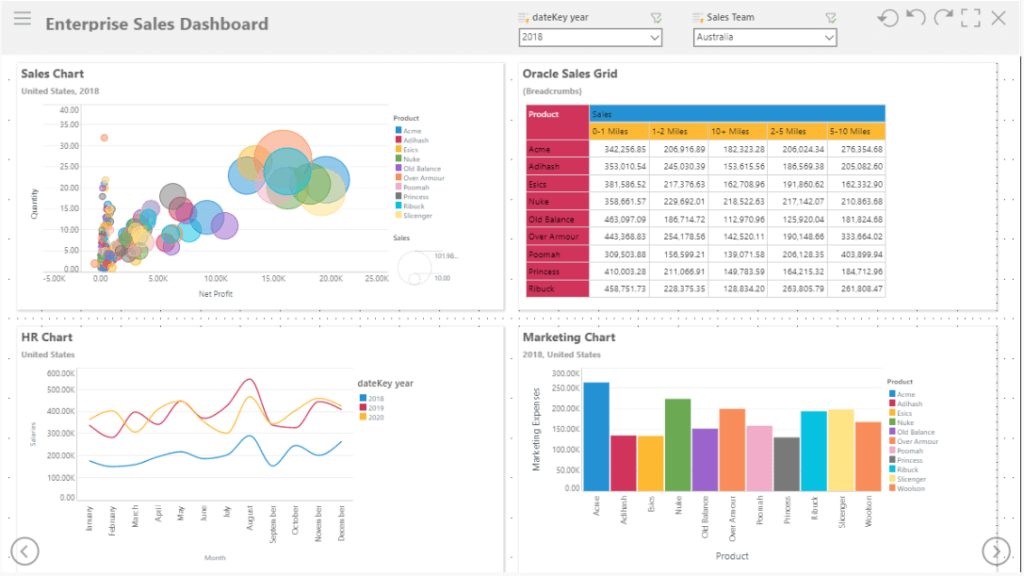
Pyramid Analytics stands at the forefront of Business Intelligence (BI) solutions for 2025, offering a comprehensive platform that empowers users with advanced analytics and simplified, user-friendly functionality. Known for its adaptability, Pyramid Analytics is well-suited for businesses of any size, providing powerful data tools that cater to both technical and non-technical users. Its design and functionality make it a valuable asset for companies aiming to achieve data-driven insights without investing in complex, resource-heavy infrastructure.
Top Features:
- Self-service analytics for non-technical users
- AI-powered insights to identify trends
- Advanced data modeling and reports
- Integrates with multiple data sources
Top Benefits:
Pyramid Analytics stands out for its combination of scalability, ease of use, and advanced data processing. Businesses can benefit from both a simplified user interface and the depth of data analysis it provides. Additionally, its adaptability to different data sources makes it a versatile choice for companies with varied data needs.
Best Use Case:
Pyramid Analytics is best for businesses seeking a powerful yet accessible BI solution, ideal for data-driven companies aiming for self-service analytics and AI-enhanced decision-making.
Pros and Cons:
Positives
✅ Easy-to-use
✅ Scalable
✅ Feature-rich
✅ Robust integrations
Negatives
❌ Complex setup for beginners
❌ Premium pricing
❌ Learning curve
Overview:
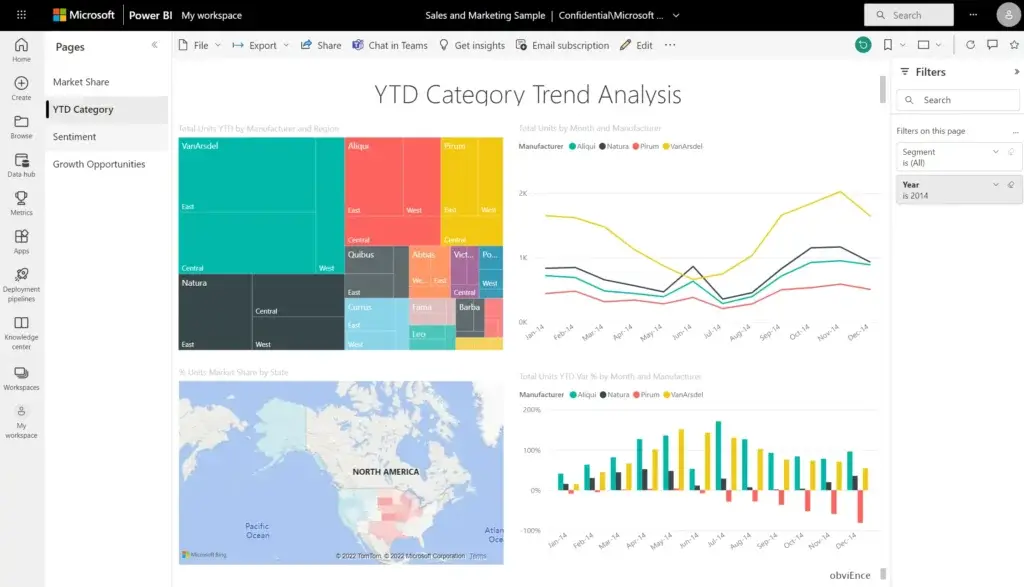
Microsoft Power BI is a widely used BI tool that offers seamless integration with Microsoft’s suite of products, making it a top choice for businesses embedded within the Microsoft ecosystem. Its powerful real-time analytics, combined with user-friendly data visualization options, enable teams to connect, analyze, and visualize data with ease. This tool’s compatibility with Office 365, Azure, and Excel ensures it fits smoothly into existing workflows, while its accessibility makes it an excellent option for non-technical users.
Top Features:
- Integrates seamlessly with Microsoft products
- Real-time analytics and visualization options
- User-friendly for non-technical users
- Customizable dashboards for specific insights
Top Benefits:
Power BI excels in its seamless integration with Microsoft products, making it a strong choice for businesses that are already Microsoft-centric. It allows non-technical teams to perform data analysis, making it highly accessible across departments.
Best Use Case:
Microsoft Power BI is ideal for organizations using Office 365 and Azure that need a straightforward, integrated BI tool for enhanced data analysis and reporting.
Pros and Cons:
Positives
✅ Microsoft Integration
✅ Easy to use
✅ Customizable
✅ Real-time insights
Negatives
❌ Limited non-Microsoft support
❌ Costly at scale
❌ Data volume limits
Overview:
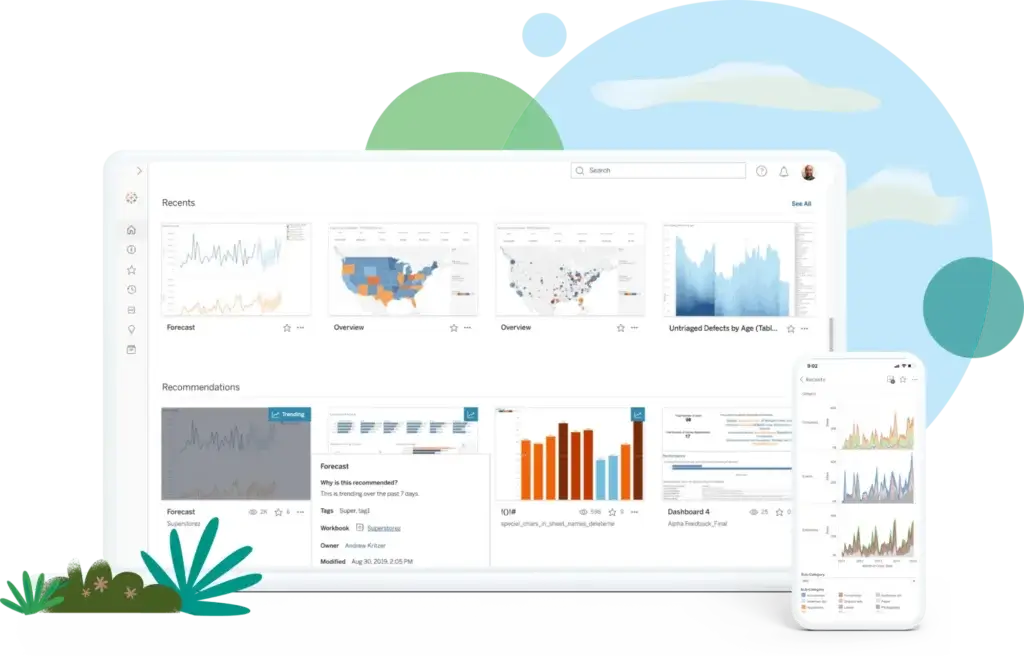
Tableau is a leading BI software known for its impressive data visualization capabilities, making it a go-to for companies that prioritize data storytelling. Its drag-and-drop interface allows users to create interactive dashboards with ease, while its integration options support a wide range of data sources. Tableau’s user-friendly design and powerful visuals make it popular among non-technical users, though advanced analytics might require additional customization. For businesses focused on visually communicating data insights, Tableau offers an intuitive and robust solution.
Top Features:
- Drag-and-drop dashboard creation
- Integration with numerous data sources
- Highly customizable data visuals
- Quick setup for fast results
Top Benefits
Tableau shines in its capacity for creating interactive, easy-to-understand visuals that can be customized to fit any data story. Its versatility makes it suitable for both small and large datasets, appealing to companies needing user-friendly yet advanced visuals.
Best Use Case:
Tableau is ideal for companies needing visually powerful dashboards to make data insights more accessible across teams.
Pros and Cons:
Positives
✅ Intuitive design
✅ Strong visual tools
✅ Broad data integrations
✅ Quick dashboard setup
Negatives
❌ Premium pricing
❌ Limited advanced analytics
❌ Requires plugins for deeper insights
Overview:
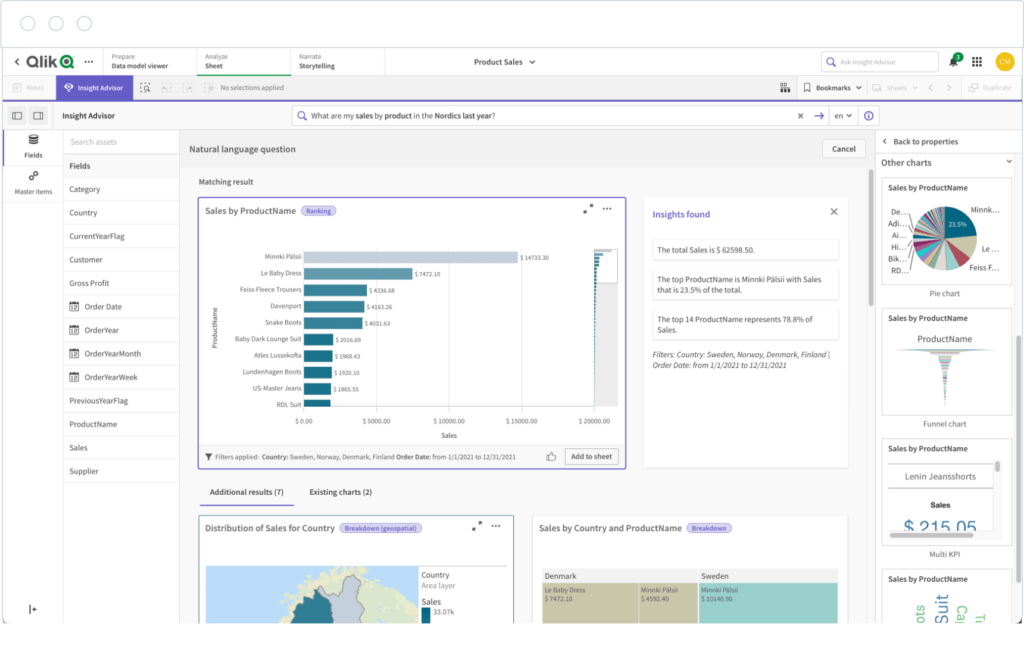
Qlik Sense is a robust BI tool known for its focus on data discovery, enabling users to uncover insights through an associative data model that reveals connections in complex data sets. The platform’s AI-driven features enhance data exploration, allowing users to identify patterns they may have missed. With customizable dashboards and support for multiple data sources, Qlik Sense caters to companies that value a blend of AI and data analysis. Its advanced data exploration capabilities make it a top choice for organizations focused on in-depth data discovery.
Top Features:
- Associative data model for exploration
- AI-powered insights and automation
- High customization options
- Supports various data sources
Top Benefits:
Qlik Sense offers a unique associative model that allows for an intuitive, non-linear approach to data exploration. This flexibility is ideal for companies looking to dive deep into data relationships while leveraging AI for real-time insights.
Best Use Case:
Qlik Sense is best suited for organizations needing to explore complex data sets in-depth and uncover relationships between diverse data points.
Pros and Cons:
Positives
✅ AI-enhanced insights
✅ Flexible data exploration
✅ Customizable dashboards
✅ Strong data integration
Negatives
❌ Complex pricing
❌ Requires training
❌ Steeper learning curve
Overview:
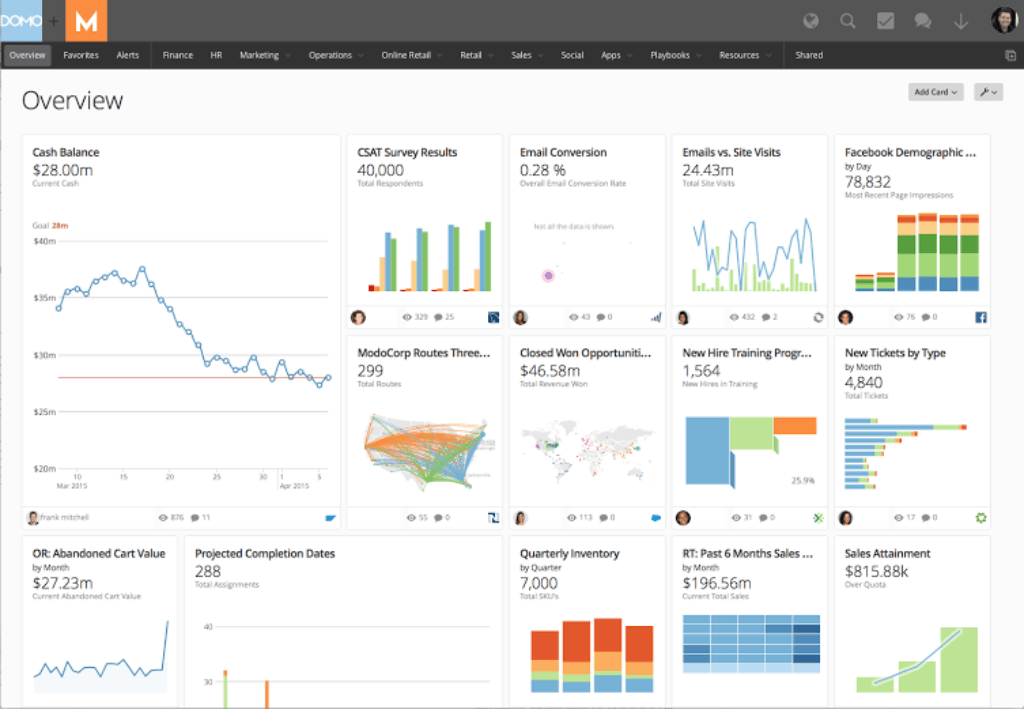
Domo stands out for its ability to provide real-time dashboards, making it a valuable tool for companies requiring instant insights. As a cloud-based platform, Domo supports easy integration with a wide variety of data sources, allowing teams to view and act on current data without delay. The platform is particularly popular among non-technical users, thanks to its accessible interface and mobile-friendly design, making it ideal for teams that need BI on the go. Domo’s real-time data capability makes it a strong choice for fast-paced environments where timely data is critical.
Top Features:
- Real-time dashboards and mobile access
- Cloud-based platform with easy integration
- Accessible for non-technical users
- Mobile-friendly design for on-the-go use
Top Benefits:
Domo’s real-time capabilities and user-friendly interface make it perfect for teams that rely on up-to-the-minute data. Its mobile functionality supports users who need access to BI insights outside traditional workspaces.
Best Use Case:
Domo is a great fit for companies needing real-time, mobile-friendly analytics and dashboards, especially in fast-paced industries.
Pros and Cons:
Positives
✅ Real-time insights
✅ User-friendly
✅ Mobile access
✅ Easy cloud integration
Negatives
❌ Limited customization
❌ High cost
❌ Limited offline capabilities
Overview:
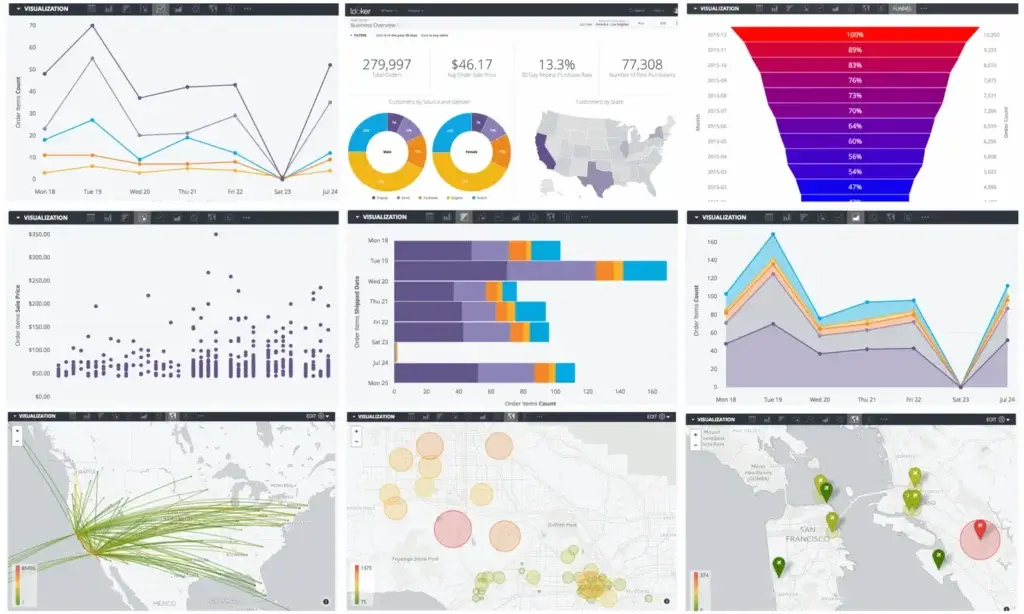
Looker is a powerful BI tool tailored for organizations that rely heavily on SQL-based analysis. Its seamless integration with Google Cloud makes it a favorite among data-driven businesses and teams comfortable with SQL. Looker enables users to create custom reports and dashboards, providing a high degree of customization for specific data needs. Though Looker requires some technical know-how, it excels at handling complex queries and creating detailed insights, making it a top choice for organizations with SQL expertise.
Top Features:
- SQL-based data exploration and analytics
- Integration with Google Cloud Platform
- High customization for reporting
- Supports various data sources
Top Benefits
Looker’s SQL-based structure allows for advanced customization and control over data analytics, making it suitable for data-heavy organizations. It offers flexibility in building detailed, tailored insights for precise decision-making.
Best Use Case:
Looker is ideal for organizations with in-house SQL expertise seeking an advanced, customizable BI tool that integrates with Google Cloud.
Pros and Cons:
Positives
✅ Highly customizable
✅ SQL-friendly
✅ Supports complex queries
✅ Integrates with Google Cloud
Negatives
❌ Requires SQL knowledge
❌ Limited non-technical usability
❌ Learning curve
Overview:
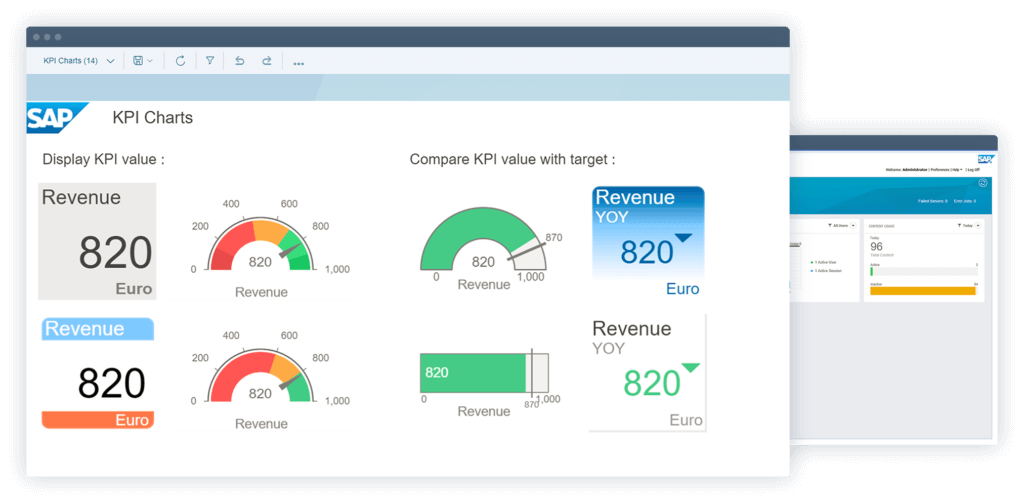
SAP BusinessObjects is a powerful enterprise-grade BI solution designed to handle the complex needs of large organizations. Known for its scalability and robust reporting features, SAP BusinessObjects supports extensive data integration and is commonly used in industries with high data security requirements. This platform excels at managing large data volumes, providing detailed insights that are crucial for long-term strategic planning. While its setup can be complex, SAP BusinessObjects remains a trusted BI choice for large enterprises with sophisticated data needs.
Top Features:
- Enterprise-grade reporting and data analysis
- Advanced data integration capabilities
- Strong data security features
- Scalable for large organizations
Top Benefits
SAP BusinessObjects is recognized for its scalability and deep analytics capabilities, tailored to meet the demands of large enterprises. Its secure infrastructure also makes it a top choice in industries that prioritize data security and compliance.
Best Use Case:
SAP BusinessObjects is ideal for large enterprises needing a highly secure, scalable BI solution with extensive data reporting and integration options.
Pros and Cons:
Positives
✅ Highly scalable
✅ Strong data security
✅ Detailed reporting
✅ Ideal for enterprise needs
Negatives
❌ High cost
❌ Complex setup
❌ Requires IT expertise
Factors to consider
Selecting the perfect Business Intelligence (BI) software for your organization goes beyond evaluating a few core features. To make an informed choice, it’s crucial to understand not only the capabilities of each tool but also how these tools align with your operational and strategic goals. Below, we’ll delve into critical aspects to consider when choosing BI software and explore related insights into production management software, essential BI features, and tips for making a confident final decision.
-
Define Your Organization’s Data Needs
- Basic Reporting vs. Advanced Analysis: Determine if your team primarily needs standard reporting capabilities or if advanced data modeling and AI-driven insights would benefit your decision-making.
- Real-Time Data: If instant data access is essential, consider tools like Domo or Microsoft Power BI, which excel at real-time analytics.
-
Consider Your Team’s Technical Expertise
- Technical vs. Non-Technical Users: Platforms like Tableau and Microsoft Power BI are accessible for non-technical users, whereas Looker is more SQL-focused and may require data expertise.
- Self-Service Capabilities: If you’re aiming to empower different departments to access and analyze data independently, Pyramid Analytics and Qlik Sense offer strong self-service options.
-
Assess Your Current Tech Stack and Integrations
- Compatibility with Existing Systems: Power BI integrates well with Microsoft ecosystems, while Looker is optimized for Google Cloud users. Check each tool’s compatibility with your current platforms to ensure smooth data integration.
- Scalability: For growing businesses or large enterprises, choosing a scalable tool like Pyramid Analytics or SAP BusinessObjects will allow your BI solution to grow alongside your company.
-
Evaluate Budget and Long-Term Costs
- Pricing Tiers: BI software varies significantly in pricing. Consider both the initial investment and long-term costs, as some platforms require higher financial commitments, especially those tailored to enterprises like SAP BusinessObjects.
- Trial Periods: Most platforms offer free trials, which are a great opportunity to test features before committing. Use trial periods to ensure that the software meets your needs in terms of usability, integration, and functionality.
Understanding Production Management Software
Before diving into specific BI software options, it’s essential to understand the core purpose and capabilities of BI tools. Business Intelligence (BI) software is designed to help organizations collect, process, and interpret data in ways that are easily accessible and actionable. From improving operational efficiency to enhancing customer understanding and guiding strategic planning, BI software serves as a central tool for data-driven decision-making.
Types of BI Software:
- Self-Service BI: Designed for non-technical users, self-service BI software enables team members across departments to access data and create reports without relying heavily on IT support. Examples include Pyramid Analytics and Power BI.
- Data Visualization Tools: Some BI tools are specialized in turning data into visual insights, making it easy for users to interpret complex datasets at a glance. Tableau is a prime example, known for its strong data visualization capabilities.
- Embedded Analytics: Embedded BI tools are built to integrate directly into existing business applications, providing real-time insights without switching systems. Looker, with its SQL-based approach and Google Cloud integration, is ideal for this use.
- Enterprise-Level BI: Enterprise BI tools like SAP BusinessObjects offer scalability and advanced features for large organizations. These tools are designed to handle high data volumes and often come with enhanced security features for compliance-sensitive industries.
By understanding the categories and applications of BI software, businesses can better assess their specific needs and identify tools that align with their objectives.
Making the Right Choice
Choosing the right BI software requires balancing your organization’s technical capabilities, business goals, and budget. Here’s a structured approach to making the best choice:
-
Identify Your Primary Objectives:
- Define what your organization needs from BI software. If your main goal is real-time operational insights, a platform like Domo or Power BI, which excels at real-time dashboards, may be ideal. For visual storytelling and reporting, Tableau’s data visualization capabilities could be more suitable.
-
Assess Team Skill Level:
- Consider who will be using the software. For example, non-technical teams might benefit from intuitive, self-service BI tools like Power BI or Tableau, which offer ease of use and don’t require coding knowledge. However, if you have a data team proficient in SQL, a tool like Looker provides deep customization options and allows more complex data analysis.
-
Evaluate the Compatibility with Existing Tools:
- Many companies already use software for ERP, CRM, or cloud storage. Opting for BI software that integrates with your existing tools can save time and improve efficiency. For example, Microsoft-based companies might benefit from Power BI due to its seamless Office 365 integration, while Google Cloud users may find Looker more suitable.
-
Think About Scalability:
- Consider your future needs. Will you need to scale your BI capabilities as your business grows? Tools like Pyramid Analytics and SAP BusinessObjects are designed to accommodate large data volumes and provide enterprise-level reporting, making them ideal for growing organizations or those that plan to expand their data needs.
-
Explore Pricing and Licensing Options:
- Budget considerations are critical, as BI software costs can vary significantly. Some platforms offer pay-as-you-go options, while others have fixed annual licenses. For smaller organizations, entry-level plans may be sufficient, while enterprise-level tools like SAP BusinessObjects require more significant investment but provide a wide range of features tailored to large businesses.
-
Utilize Trial Periods for Testing:
- Most BI providers offer free trials or demos, which are invaluable for assessing how well a platform fits your team’s workflow. Use this time to test the software’s user interface, reporting capabilities, data connectivity, and support options. Involving multiple departments in testing can provide a well-rounded understanding of how the tool will support your organization’s goals.
Taking these steps will guide you toward a BI tool that not only meets your immediate needs but also adapts as your business scales. By aligning BI software with your organization’s specific goals and technical requirements, you’ll set the stage for a more data-driven, agile, and strategically guided future.
Conclusion
Investing in the right Business Intelligence software can transform how your company approaches data, providing valuable insights that drive smarter decisions and foster growth. With options like Pyramid Analytics for advanced data modeling, Tableau for stunning visualizations, and Domo for real-time mobile dashboards, there is a BI tool for every type of organization and data strategy.
Consider your organization’s unique needs, existing tech stack, and data-driven goals to choose a solution that aligns best with your team’s skills and workflows. BI software should empower your business to harness the power of data, improving both day-to-day decision-making and long-term strategic planning. Explore the trial options, consult with team members, and take the time to fully understand which tool will provide the insights you need to stay competitive in 2025 and beyond.
FAQs
1. What is Business Intelligence (BI) software?
Business Intelligence (BI) software helps organizations analyze data to make informed business decisions. BI tools collect, process, and visualize data from various sources, turning it into insights that guide strategy, operations, and forecasting. These tools empower companies to understand trends, optimize processes, and make data-driven decisions.
2. Why do companies need BI software?
BI software enables companies to make data-driven decisions, leading to improved efficiency, customer insights, and competitive advantage. By using BI tools, organizations can streamline reporting, uncover hidden patterns in data, and respond quickly to market changes. BI software also democratizes data, allowing employees across departments to access and analyze data independently.
3. What are the top features to look for in BI software?
Answer: Key features include data integration, real-time analytics, data visualization, AI-driven insights, and strong security protocols. These features ensure that the BI tool not only meets your data processing needs but also adapts to your organization’s infrastructure and compliance requirements.
4. How can BI software improve data-driven decision-making?
BI software transforms raw data into visual, actionable insights, making complex information more accessible. With real-time analytics, data discovery tools, and predictive analytics, BI platforms allow companies to quickly respond to trends, optimize performance, and make informed decisions based on data rather than intuition.
5. What are some popular BI software options in 2025?
The top BI tools in 2025 include Pyramid Analytics, Microsoft Power BI, Tableau, Qlik Sense, Domo, Looker, and SAP BusinessObjects. Each tool offers unique strengths, from advanced analytics to ease of use, catering to various business needs and technical requirements.
6. Which BI software is best for small businesses?
Small businesses benefit from intuitive, cost-effective options like Microsoft Power BI and Tableau, which offer accessible interfaces and self-service features. These tools are often more affordable and easier to deploy, allowing small teams to make the most of their data without extensive technical expertise.
7. How do I choose a BI tool that fits my business’s needs?
Answer: Start by identifying your business objectives and data needs, such as real-time analytics or data visualization. Consider your team’s technical skills, current tech stack, scalability needs, and budget. Testing tools through free trials can also help you find a platform that aligns with your goals and workflows.
8. What’s the difference between self-service BI and enterprise BI?
Self-service BI is designed for ease of use, enabling non-technical users to access and analyze data without relying on IT support. Enterprise BI, on the other hand, offers advanced analytics, scalability, and security features suited for large organizations with complex data needs, often requiring dedicated IT support and resources.
9. How much does BI software typically cost?
BI software pricing varies based on features, scalability, and user licenses. Costs can range from affordable, subscription-based models like Power BI’s monthly plans to premium enterprise options like SAP BusinessObjects, which require larger investments. Pricing generally increases with features like AI-driven insights, data integration capabilities, and customizability.
10. What should I expect during the implementation of BI software?
BI software implementation involves integrating the tool with your existing data sources, configuring user access, and setting up dashboards and reports. Implementation times vary, from a few days with simpler tools to several months for complex, enterprise-grade software. Training users and refining workflows are also important steps for a successful rollout.


